Trading from Charts: Managing Working Orders
Introduction
FinStudio's trading platform enhances the visualization and management of working orders directly on the charts. This integration allows traders to interact with their orders visually, enhancing clarity and control over their trading activities.
Displaying Orders on Charts
Traders have the option to display all placed orders directly on the chart. This visual representation helps in tracking and managing orders efficiently against the backdrop of market price movements.
Order Summary
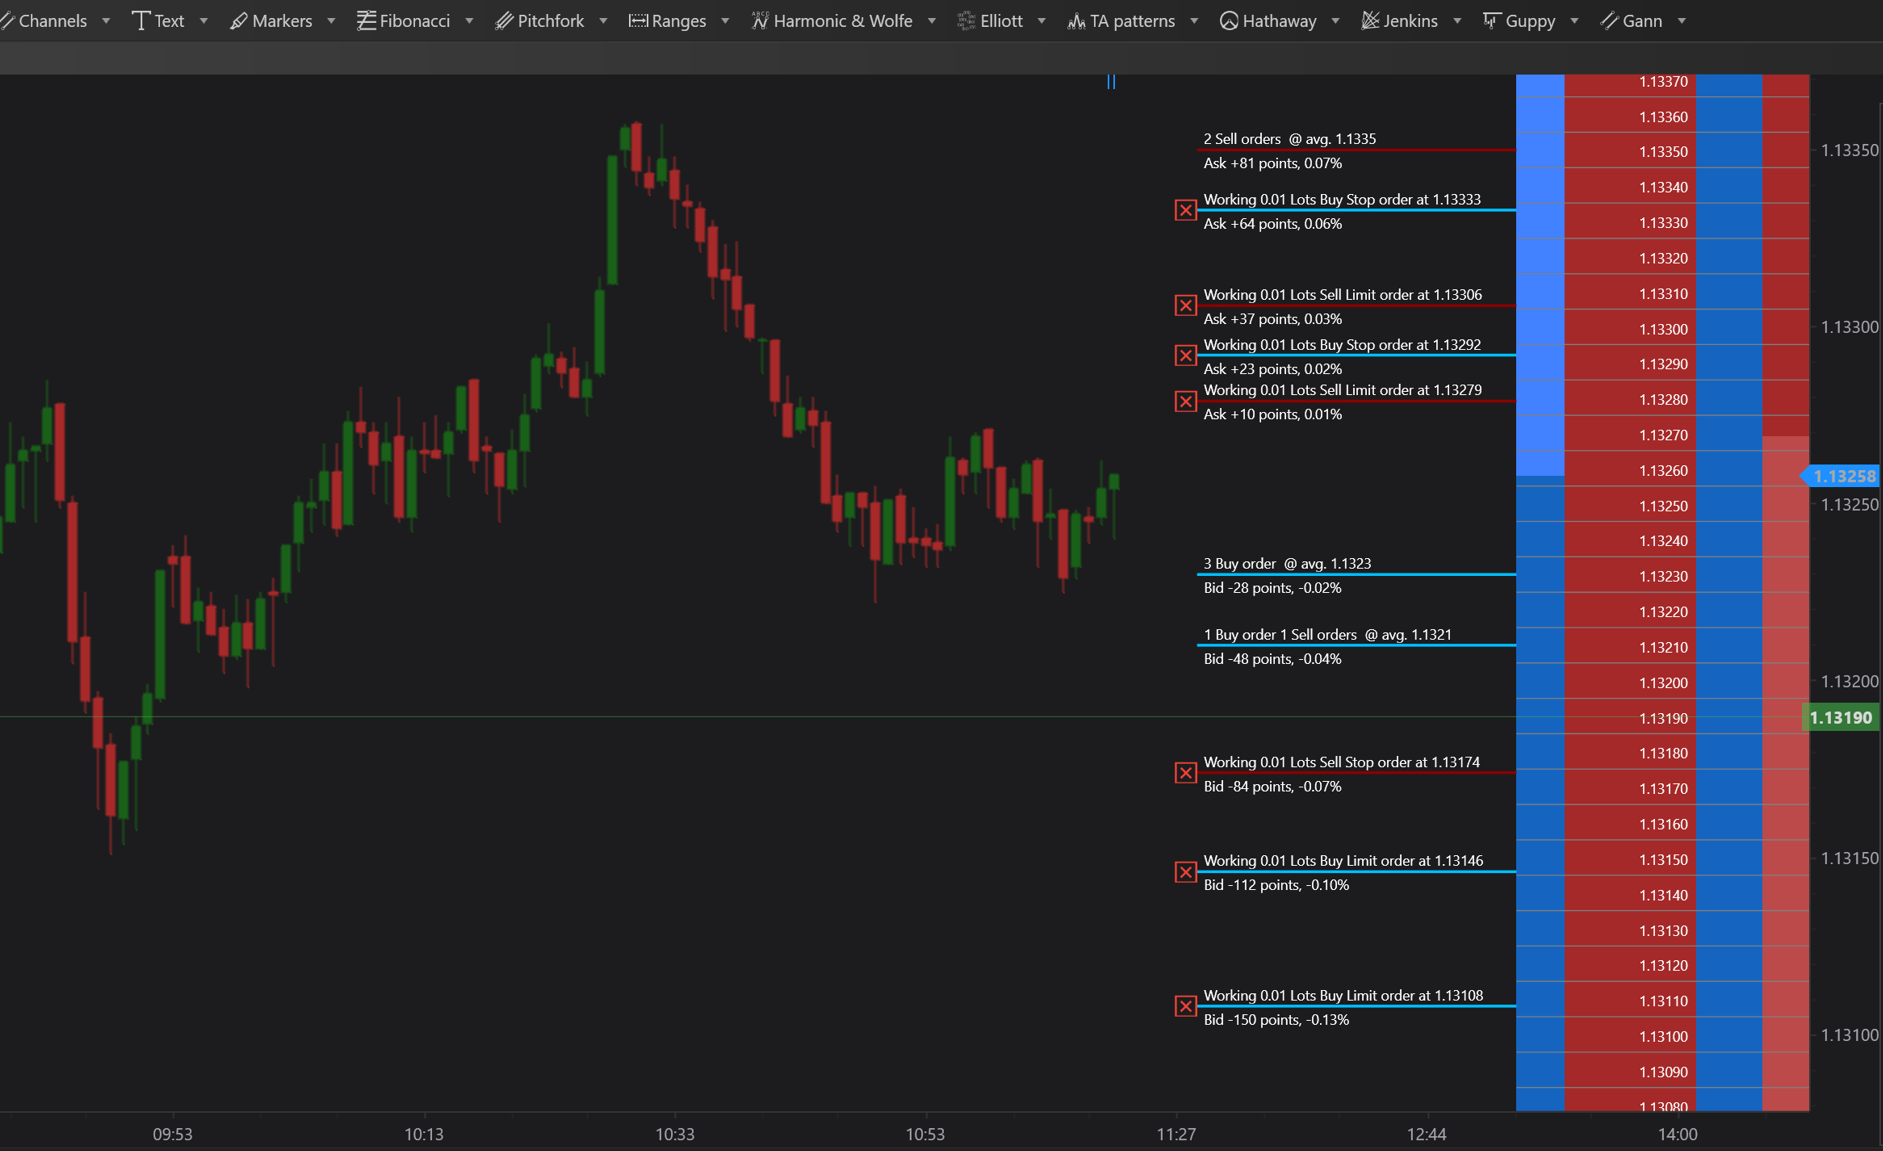
Each order displayed on the chart includes detailed information arranged in a clear and organized format:
-
Top Part
- Order Status: Shows whether the order is active, filled, or cancelled.
- Order Size: Indicates the volume of the order.
- Order Type: Specifies whether it is a Buy or Sell order.
- Order Entry Price: The price at which the order was placed.
-
Bottom Part
- Distance from Current Market Price: This is shown in both points and percentages, providing a quick reference to how close or far an order is from being executed.
Visual Customization
-
Colors
- Orders are color-coded for quick identification: Buy orders are displayed in blue, while Sell orders appear in red.
- Users have the flexibility to adjust these colors based on their personal preferences to enhance visibility and differentiation.
Order Grouping
- To avoid clutter and ensure clarity, orders placed at the same price level are grouped together. This feature is particularly useful in busy trading environments or for those managing multiple orders.
- Group Interaction: Users can right-click on a grouped set of orders to view detailed information for each order within the group, simplifying order management and review.
Order Management Tools
- Cancel Order: Orders can be cancelled directly from the chart with a simple click on a red 'X' icon, facilitating quick adjustments and responses to changing market conditions.
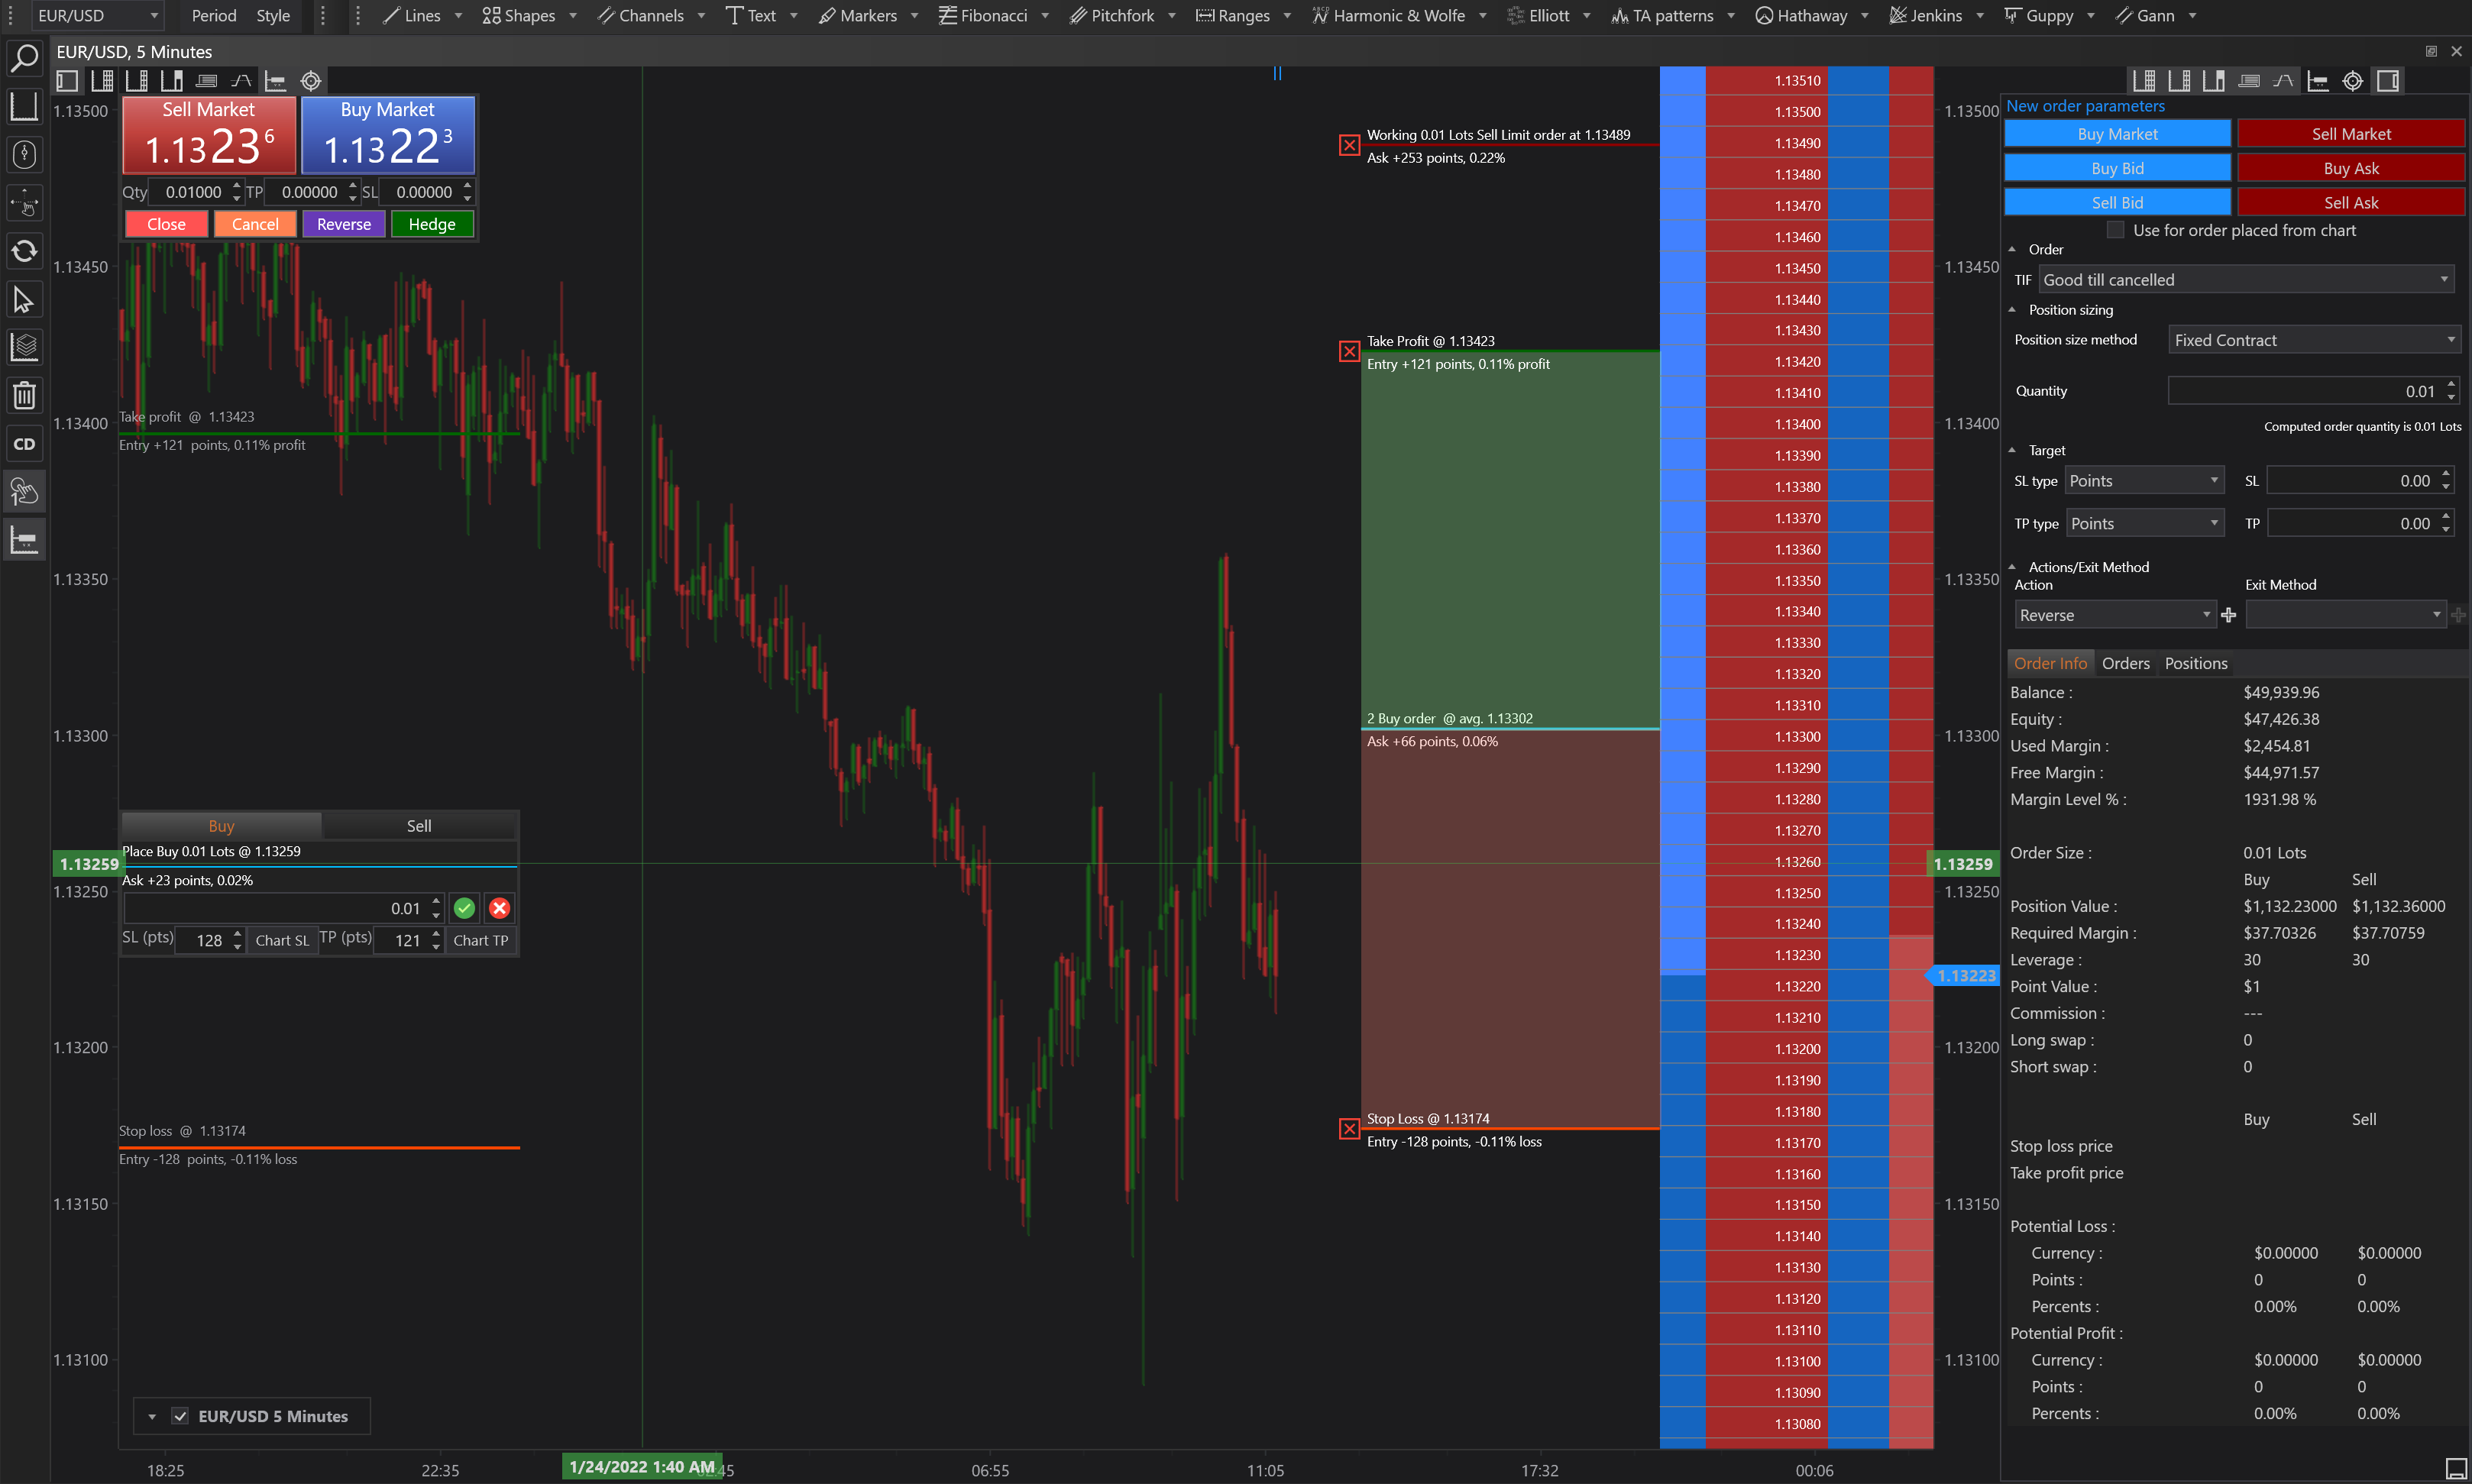
- Show Take Profit and Stop Loss Areas:
- For enhanced trade management, traders can opt to display designated areas for Take Profit (TP) and Stop Loss (SL) on the charts.
- These areas can also be filled with color, providing a visual representation of risk management strategies and helping traders to see at a glance the potential exit points for each active order.
Conclusion
The integration of working orders into the trading charts in FinStudio provides traders with a powerful tool for managing their trades directly within the chart interface. This feature not only simplifies the process of order adjustment and cancellation but also enhances the strategic deployment of orders by allowing traders to visualize their potential impact in real-time market conditions. By combining detailed order information, customizable visual cues, and interactive grouping, FinStudio makes it easier for traders to maintain control over their trading strategies and to react dynamically to the market.