Module Functionality
The module operates dynamically to show detailed information about the specific part of the chart that a user is examining. Here’s how it enhances the user experience and data interaction:
-
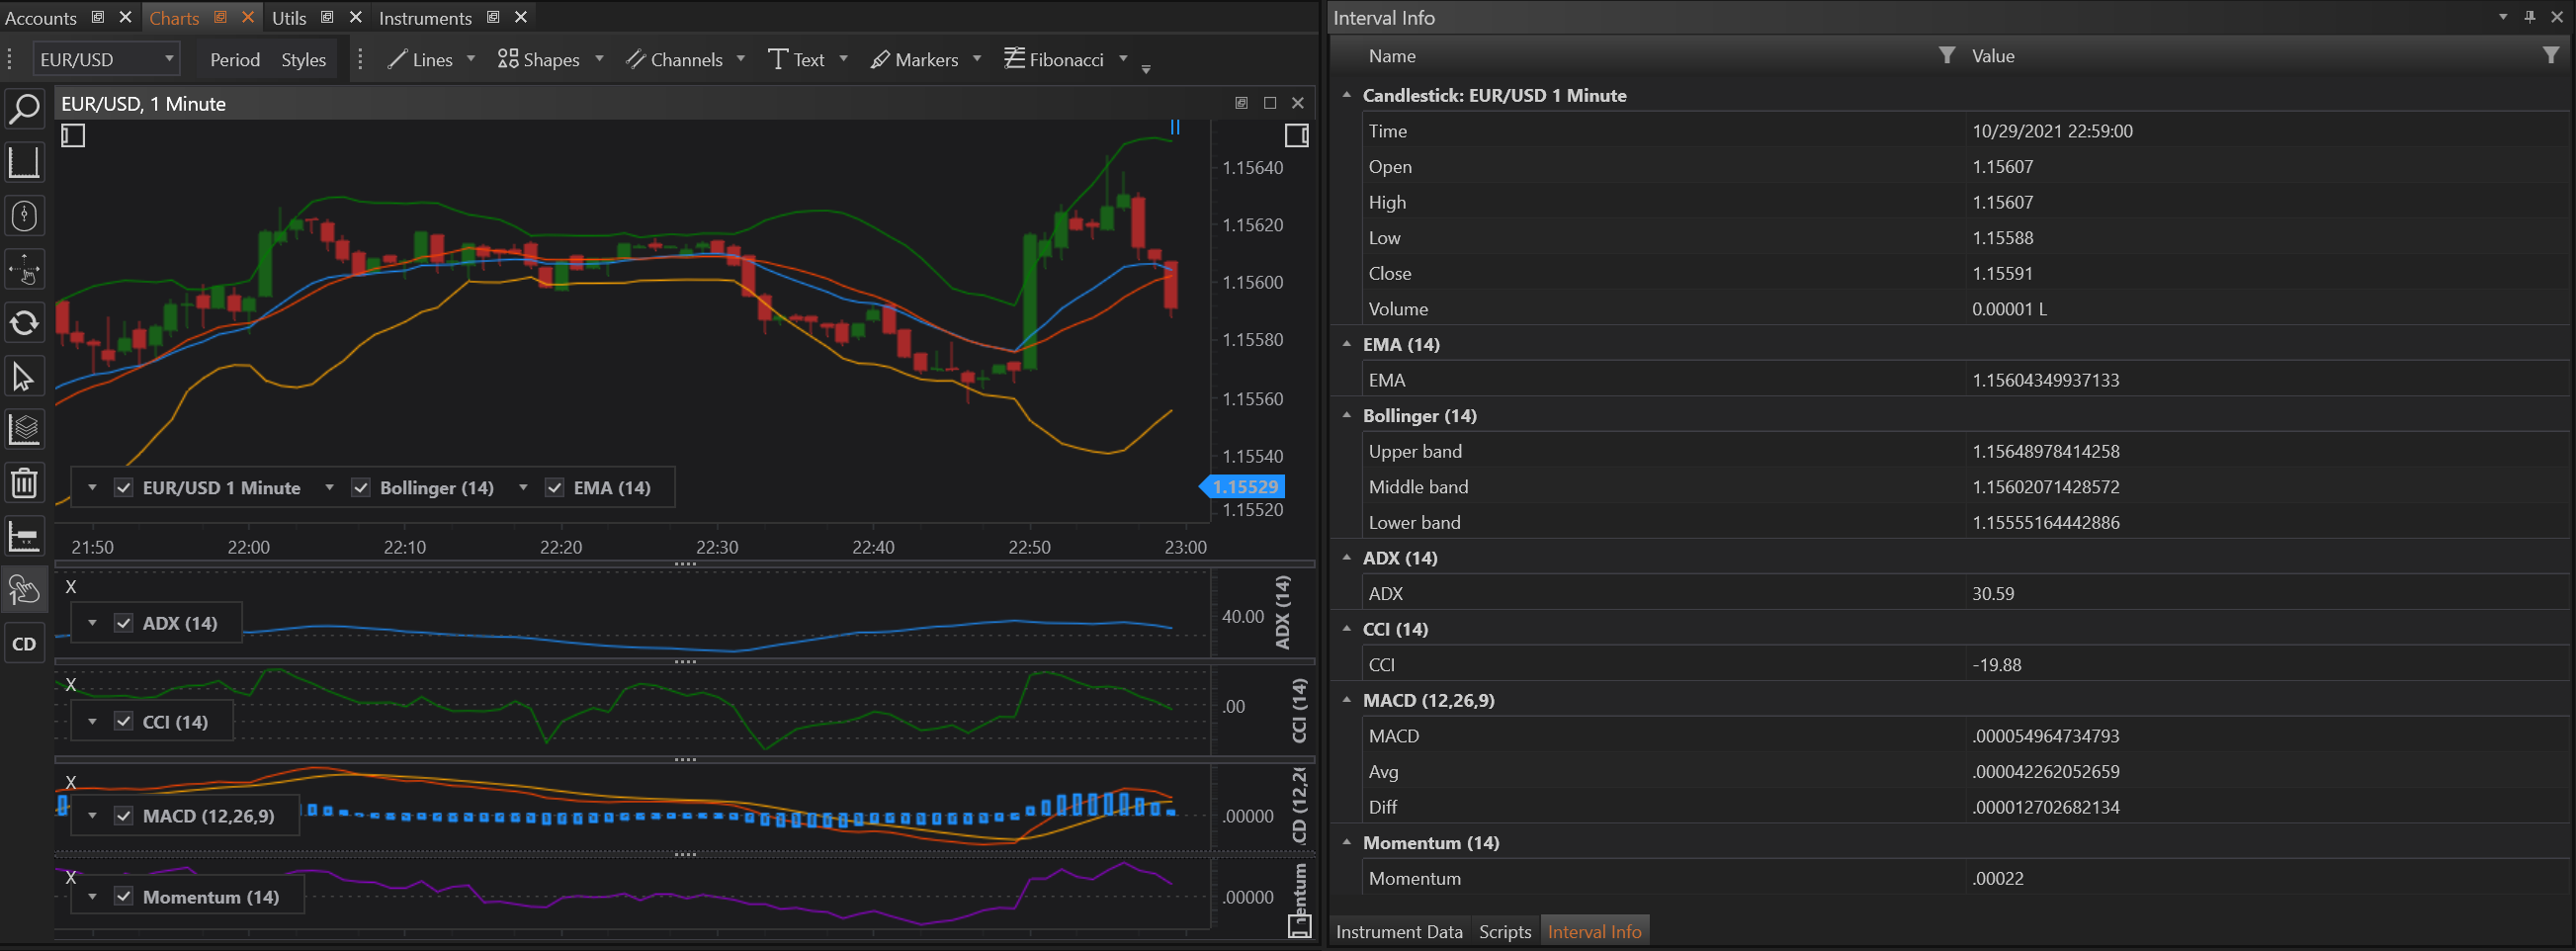
Real-Time Data Display: As the user hovers over any interval on the chart, the module instantly displays raw data for that specific interval. This includes the open, high, low, and close values (OHLC), along with any other pertinent data points.
-
Comprehensive Indicator Information: Beyond basic interval data, the module also provides details on any indicators that have been added to the chart. Whether it’s moving averages, RSI, MACD, or custom indicators, the information about how these indicators interact with the specific interval is readily available.
-
Pattern Recognition: For users utilizing pattern recognition techniques or algorithms, the module shows relevant information about any recognized patterns within the specific interval. This could include patterns like head and shoulders, triangles, or candlestick formations.
-
Extensible to Include Additional Data: The flexibility of the module allows it to display practically any data related to that interval. This could include derivative data like derivative oscillators, volume profile, or other analytics that provide deeper insights into market behavior.
Practical Applications
This module is not just a passive display; it is an interactive tool that enhances the analytical capabilities of users by providing them with detailed, on-demand data.
-
Data Clarity: Charts can often become cluttered, especially when multiple indicators or complex patterns are applied. The data module simplifies this by providing clear and concise data about the selected interval in one place, without the need to decipher overlapping lines or obscured figures on the main chart.
-
Instant Data Access: The ability to instantly view detailed information about a chart interval as users hover over different parts of the chart streamlines the analytical process. This immediate access is crucial for fast-paced trading environments where time and accuracy are paramount.
-
Enhanced Decision Making: With all pertinent data from a specific interval presented clearly, traders can make more informed decisions. This is especially useful in technical analysis, where the significance of price movements and indicator values can dictate trading strategies.
-
Error Reduction: By providing a definitive, clear view of the data for each interval, the module helps reduce errors that might occur from misinterpreting visually complex information on the chart. Traders can rely on the data presented in the module as a double-check against their visual analysis.