In FinStudio's Data Analysis - Historical Data Statistics module, the Average Change Analysis section offers a detailed examination of the instrument's price movements from the open to close over various intervals. This analysis is crucial for understanding the directional behavior of the market and assessing the average magnitude of price changes during specific periods.
Understanding Average Change Analysis
Average change analysis measures the difference between the opening and closing prices of an instrument over selected intervals. It helps determine whether the market generally closes higher or lower than it opens, indicating bullish or bearish trends.
Average Change by Day (in points and percent)
- Definition: Calculates the average change from the opening to the closing price for each weekday, expressed both in points and as a percentage of the opening price.
- Utility: This metric helps traders identify which days of the week typically experience the most significant movements, assisting in planning when to trade or avoid the market based on historical volatility and directional trends.

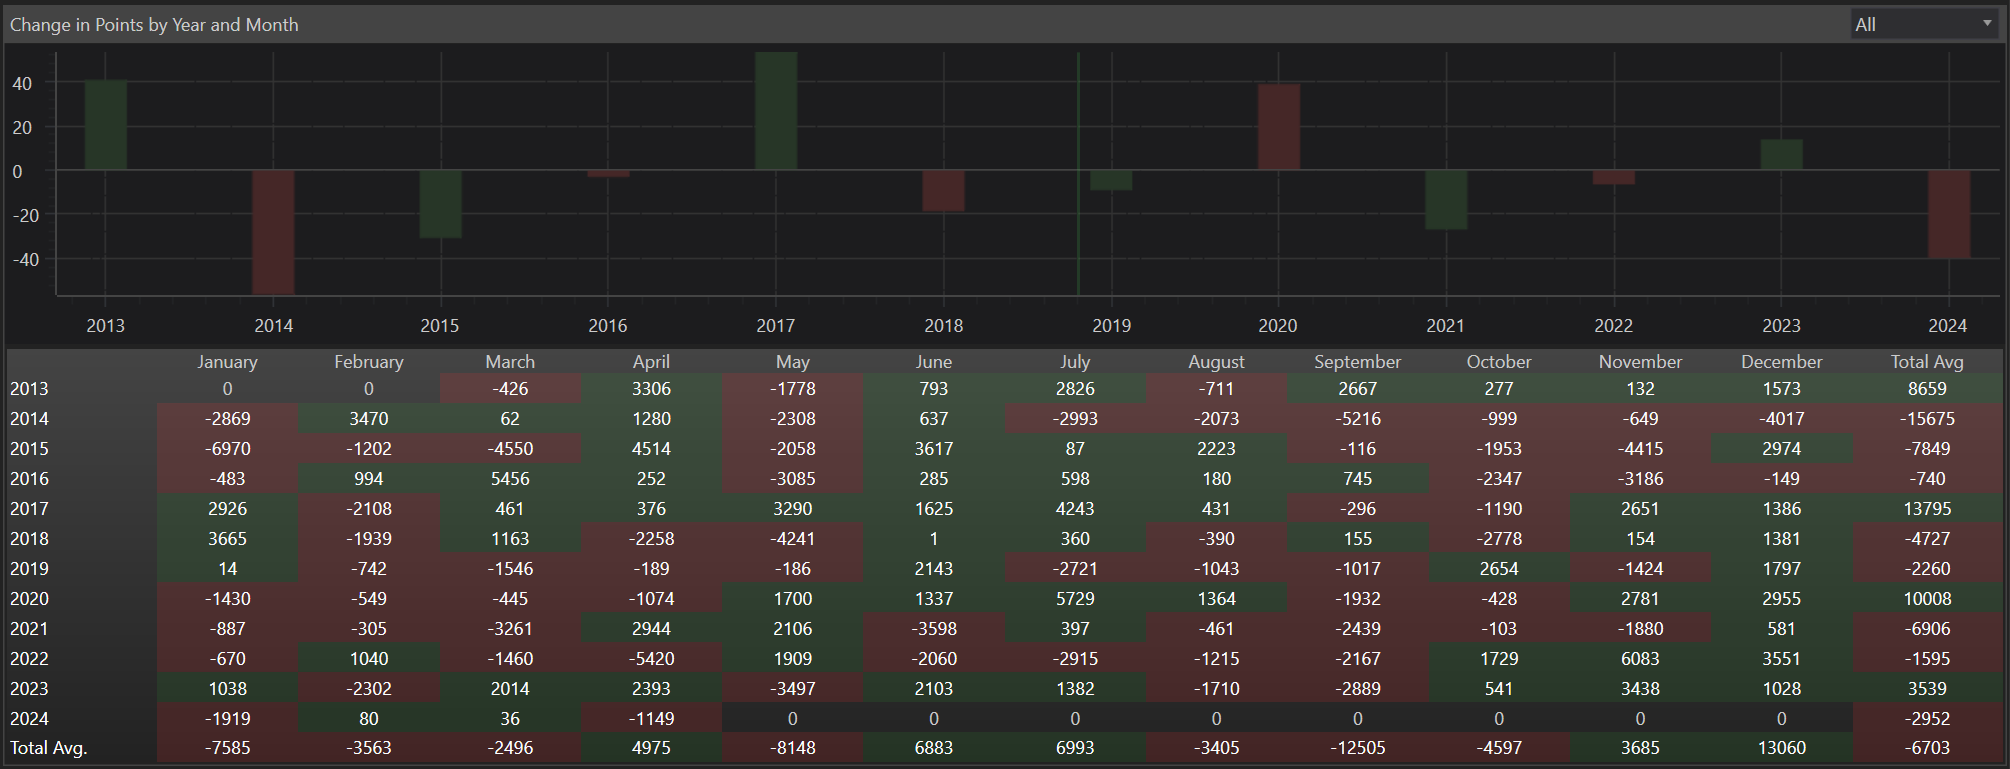
Average Change by Year and Month
- Definition: Shows the average change per year and also by month over the selected time range, providing insights into long-term trends and seasonal variations in market behavior.
- Utility: Useful for long-term investors or traders looking to capitalize on predictable seasonal fluctuations or annual trends in specific instruments.
Average Change by Day and Hour
- Definition: Details the average change for each day and hour, offering a granular view of when the instrument typically experiences the most substantial price movements throughout the trading day.
- Utility: Invaluable for day traders and those employing high-frequency trading strategies, allowing them to target specific times when the market shows greater movement, potentially increasing profitability.

Practical Applications of Average Change Analysis
-
Trade Timing and Strategy Development: By understanding the average daily, monthly, and hourly changes, traders can better time their entries and exits, aligning their strategies with the most active trading periods to maximize gains or minimize exposure to risk.
-
Risk Management: Knowing the typical price change can aid in setting more accurate stop-loss and take-profit levels, ensuring these settings are aligned with historical price movements rather than arbitrary values.
-
Seasonal and Intraday Adjustments: Adjusting trading strategies based on monthly and hourly data helps exploit times with higher average changes, potentially leading to better risk-adjusted returns. For instance, if an instrument shows higher volatility at the market open or during specific months, traders can adjust their positions to take advantage of these patterns.
-
Performance Measurement and Adjustment: Traders and analysts can measure their strategies against the average market movements to ensure they are performing above average. If not, they may need to adjust their tactics or timing to align better with market dynamics.