In FinStudio, the Data Analysis - Historical Data Statistics module is designed to provide a comprehensive analysis of historical market data. This module allows users to perform detailed statistical analysis based on selected parameters, aiding in both retrospective evaluations of market behavior and strategy development.
Setting Up Period Selection
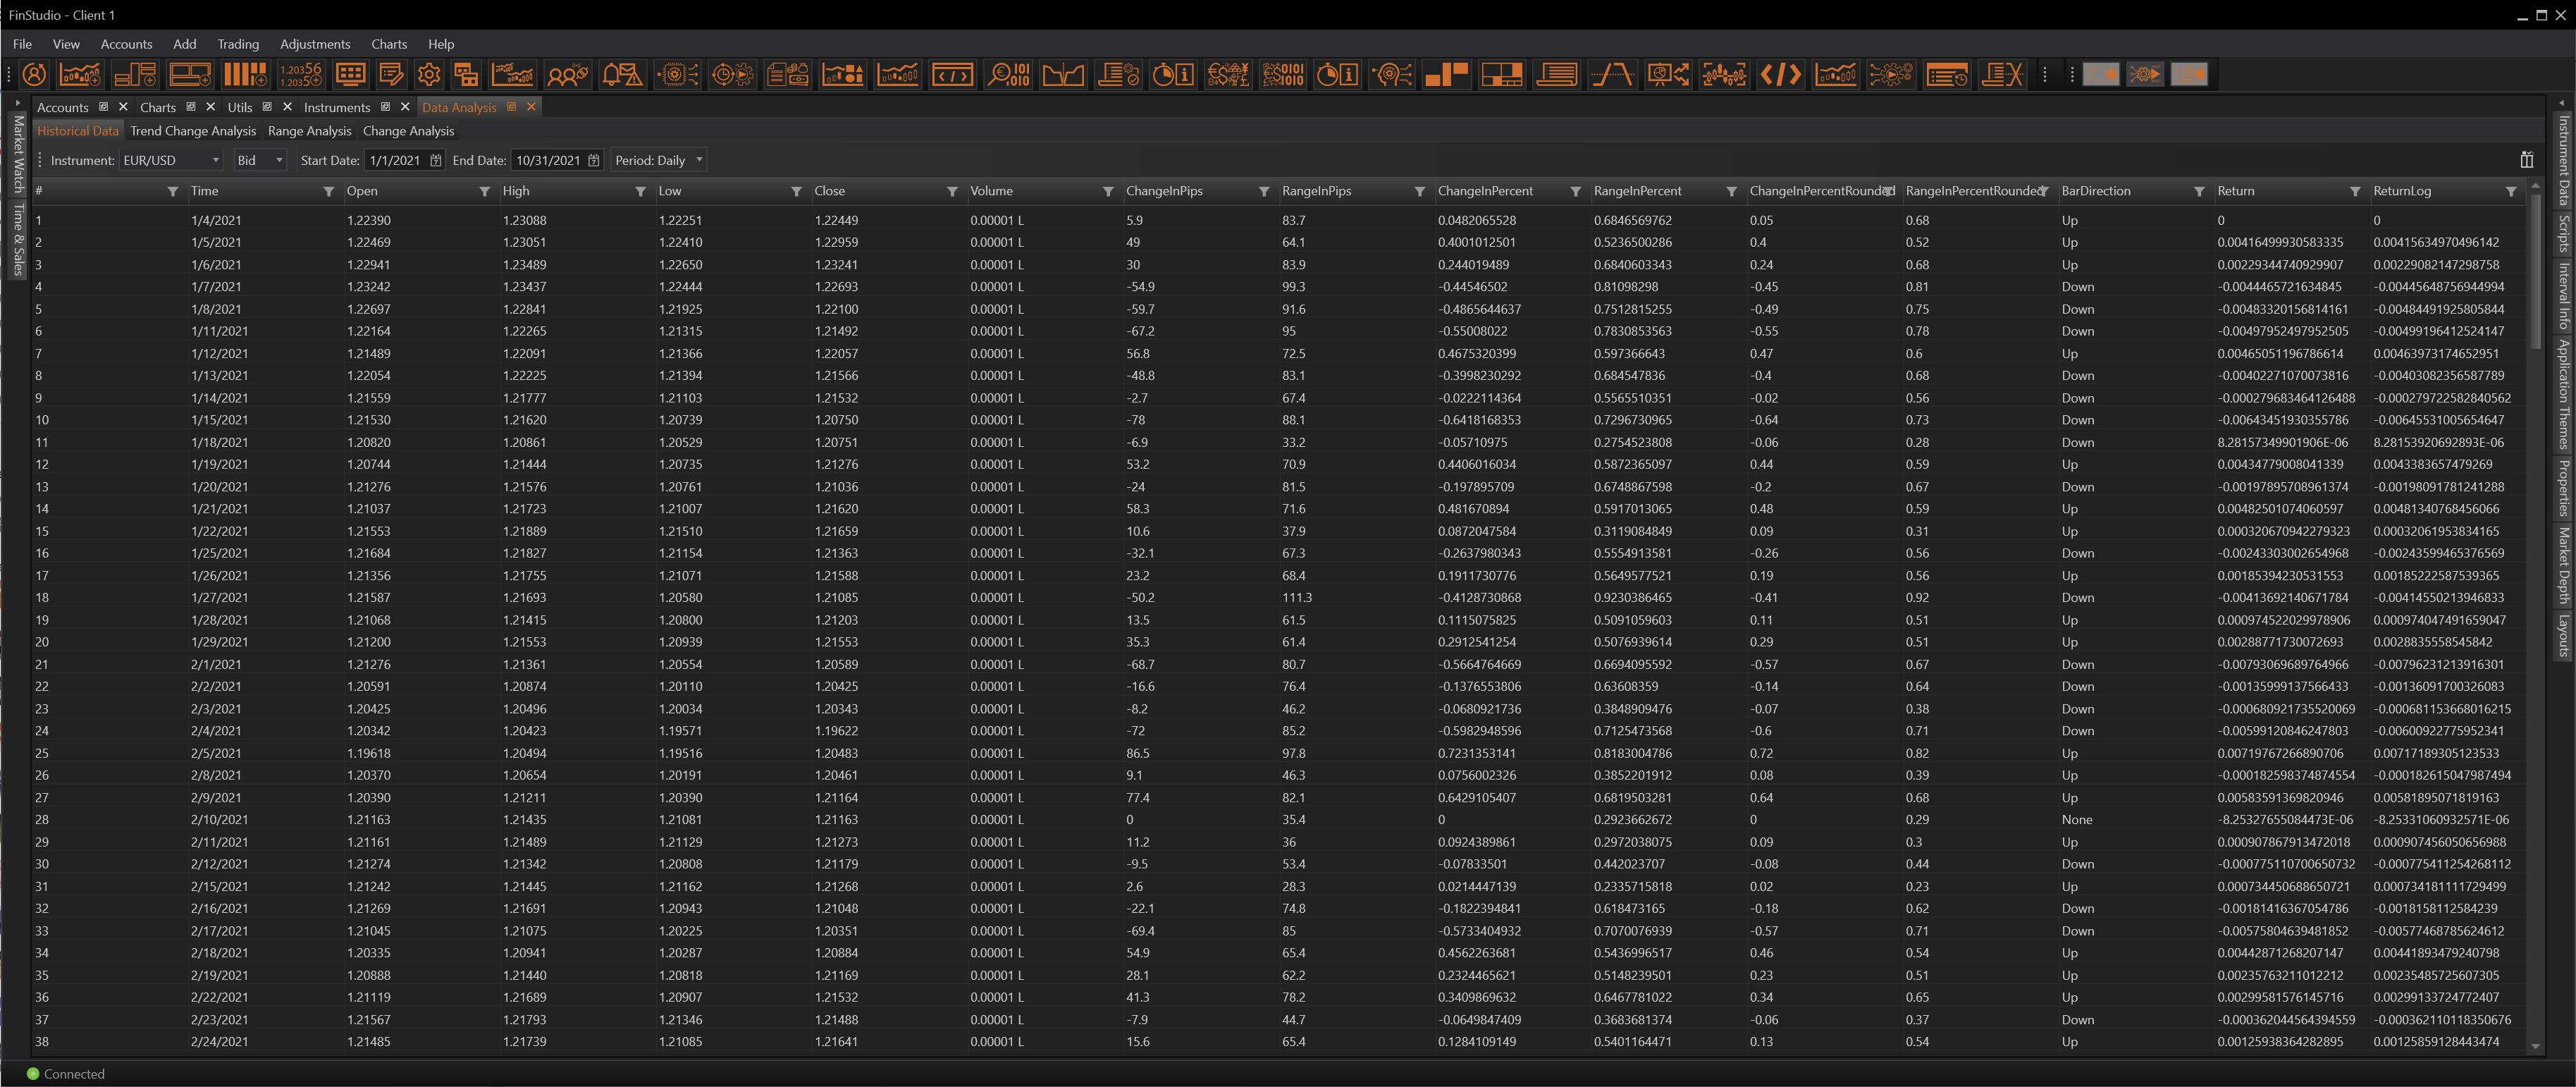
To begin the analysis, users must configure a few essential parameters:
-
Instrument Selection: Choose the financial instrument you want to analyze. This could be any market asset available in FinStudio, such as stocks, forex pairs, commodities, etc.
-
Price Type: Decide which price type to analyze. Options typically include open, high, low, close, and sometimes adjusted close prices.
-
Time Range: Specify the start and end dates for the data you wish to analyze. This defines the historical period that will be considered in the analysis.
-
Period Interval: Select the time interval for the data points (e.g., 1-minute, daily, weekly). This will determine the granularity of the data analysis.
Once these parameters are set, FinStudio retrieves the historical data for the specified instrument and time frame and begins the calculation process.
Calculated Data Points
The module calculates and displays a variety of data points to offer insightful analysis:
- Time: The timestamp for each data point.
- Open, High, Low, Close (OHLC): The opening, highest, lowest, and closing prices for each interval.
- Volume: The volume of trades that occurred in each time interval.
- Change in Pips: The price movement in pips from the open to close within the interval.
- Range in Pips: The high to low price movement in pips for each interval.
- Change in Percent: The percentage change from the open to close.
- Range in Percent: The percentage movement from high to low within the interval.
- Change in Percent Rounded: The percentage change rounded to a more readable format.
- Range in Percent Rounded: The range percentage rounded for simplicity.
- Bar Direction: Indicates whether the interval closed higher or lower than it opened (Bullish or Bearish).
- Return: The simple return from the open to close.
- Return Log: The logarithmic return, useful for various financial calculations and modeling.
Practical Applications
This robust analysis provides several practical benefits:
- Market Trends: Understanding how an instrument has performed over time, helping to identify long-term trends or recurring patterns.
- Strategy Testing: Analysts can use historical statistics to test how particular strategies would have performed under past conditions.
- Risk Assessment: Calculating changes in pips and percentage ranges helps in assessing the volatility and potential risk associated with an instrument.
- Educational Insights: For new traders or students, this module serves as a practical tool to learn about market dynamics and statistical analysis.