In the Range Analysis section of FinStudio's Data Analysis module, the focus shifts to evaluating the average range movements of an instrument. This analysis is crucial for traders and analysts who are interested in understanding the typical price fluctuations an instrument experiences over various time frames. By measuring the distance between the high and low prices within a given interval, this section provides valuable insights into market volatility and liquidity across different periods.
Understanding Range Analysis
Range analysis helps to quantify how much an instrument moves within a given period, which is essential for identifying volatility patterns and potential trading opportunities.
Average Range by Day (in points and percent)
- Definition: Calculates the average daily range from Monday to Sunday, presented both in points and as a percentage of the starting price.
- Utility: Knowing the average range by day can help traders anticipate daily volatility, adjust their trading strategies accordingly, and manage risk based on typical daily price movements.

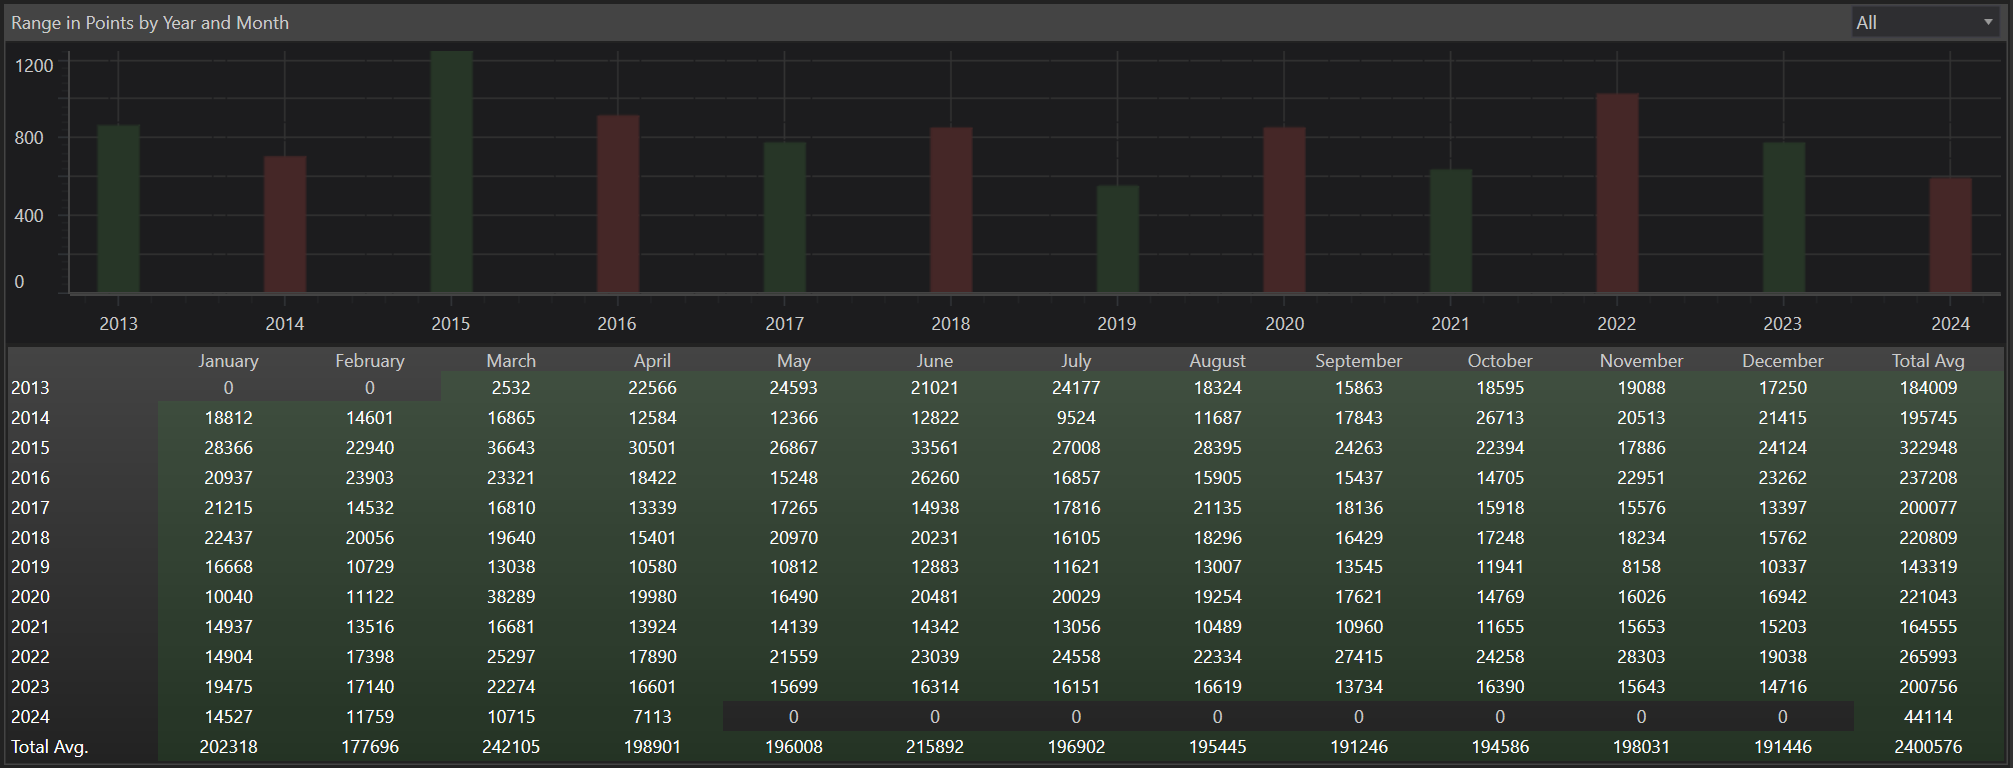
Average Range by Year and Month
- Definition: Displays the average range per year and also by month over the selected time range.
- Utility: This information is useful for identifying seasonal patterns or yearly trends in price movements, which can influence long-term trading or investment decisions.
Average Range by Day and Hour
- Definition: Calculates the average range for all days and specific hours of the day.
- Utility: This detailed breakdown helps in pinpointing the times of day when the instrument is most volatile, guiding decisions on timing trades to capitalize on higher liquidity or avoid excessive risk.

Practical Applications of Range Analysis
-
Strategy Development: Traders can use these insights to develop strategies that are aligned with typical market behaviors on certain days of the week or during specific months. For example, if an instrument shows greater volatility in the first hour after market opening, traders might focus their efforts during this time.
-
Risk Management: By understanding the average price range an instrument might cover, traders can set more effective stop-loss and take-profit levels, ensuring these are neither too tight to be triggered by normal volatility nor too loose, risking unnecessary losses.
-
Performance Optimization: Investors and traders can optimize their trading performance by adjusting their trading times and strategies based on when an instrument typically shows the most significant movement, thus maximizing potential gains.
-
Seasonal and Hourly Adjustments: For portfolio managers and long-term investors, knowing the monthly and yearly range averages can aid in planning entry and exit points based on historical performance during these periods. Similarly, intra-day traders can adjust their schedules to be active during hours of higher average movements.