The Data Analysis - Trend Change Analysis module in FinStudio was inspired by an insightful article that highlighted the significance of fundamental price movement analyses. Recognizing the utility of such an analytical tool, we integrated this concept into FinStudio to offer our users an in-depth examination of basic price components such as open, high, low, close, volume, and the range of price changes.
Understanding Interval Data
This module is adept at conveying intricate details about price movements within a specified timeframe, making it invaluable for traders aiming to understand market dynamics thoroughly.
Key Features of Interval Data Analysis:
-
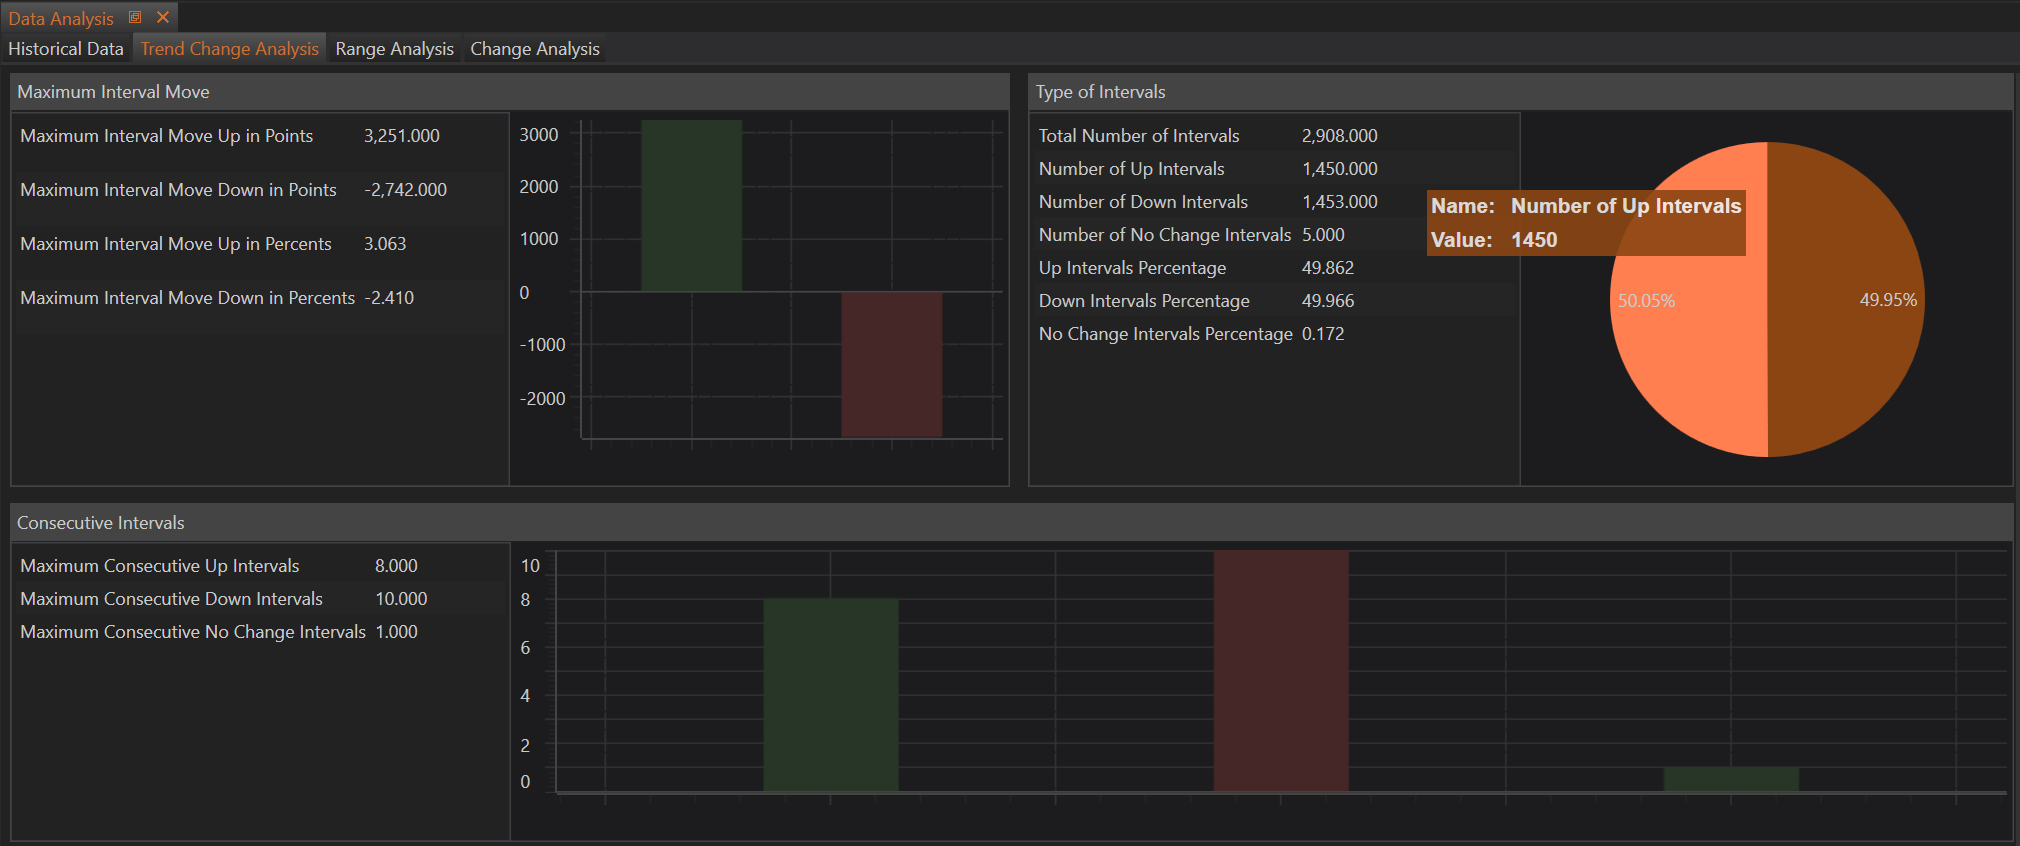
Maximum Daily Move: This feature illustrates the maximum percentage or point movement in the market, either upward or downward, during a single interval. It captures the most significant price changes within the chosen time range, providing a clear picture of market volatility.
-
Maximum Interval Move Up: Calculates the largest increase in market price during the selected interval. For example, if a user selects a 1-day period over the past three months, this function will highlight the day with the highest price surge, quantifying it in points (e.g., 3000 points).
-
Maximum Interval Move Down: Mirrors the functionality of the Maximum Interval Move Up but focuses on the largest decline in market price during the selected time frame.
Understanding Type of Intervals
The Type of Intervals section in FinStudio’s Data Analysis - Trend Change Analysis module provides a comprehensive view of market dynamics by segmenting and analyzing the data according to the behavior of intervals over a selected time range. This analysis is crucial for understanding market trends, assessing volatility, and developing trading strategies based on historical performance.
Overview of Interval Types
Total Number of Intervals
- Definition: Represents the total count of period intervals within a specific time range that are analyzed.
- Example: Selecting a 1-day interval over the past 3 months would yield a total count of all trading days within those 3 months, such as 100 days.
Types of Interval Movements
-
Number of Up Intervals: Indicates the number of days the market closed higher than it opened, suggesting bullish market conditions.
-
Example: If out of 100 total days, 53 days closed above the daily open.
-
-
Number of Down Intervals: Reflects the number of days the market closed lower than it opened, indicating bearish conditions.
-
Example: If out of 100 total days, 45 days closed below the daily open.
-
-
Number of No Change Intervals: Counts the days where the market opened and closed at the same price, showing no significant market movement.
-
Example: If out of 100 total days, 2 days closed at the same price as they opened.
-
Interval Movement Percentages
-
Up Intervals Percentage: The proportion of up intervals relative to the total number of intervals.
-
Example: 53% if 53 out of 100 days closed higher.
-
-
Down Intervals Percentage: The proportion of down intervals relative to the total number.
-
Example: 45% if 45 out of 100 days closed lower.
-
-
No Change Days Percentage: The proportion of no change intervals relative to the total number.
-
Example: 2% if 2 out of 100 days showed no price change.
-
Analysis of Consecutive Intervals
Maximum Consecutive Intervals
-
Maximum Consecutive Up Intervals: The longest sequence of consecutive intervals where the market continuously closed higher than it opened.
-
Insight: This metric helps identify sustained bullish trends within the market.
-
Maximum Consecutive Down Intervals: The longest sequence of consecutive intervals where the market continuously closed lower than it opened.
-
Insight: Useful for detecting prolonged bearish trends.
-
Maximum Consecutive No Change Intervals: The highest count of consecutive intervals that ended with no price change.
-
Insight: Although rare, this statistic can indicate periods of low volatility or indecision in the market.
Practical Applications
This detailed interval analysis empowers traders and analysts to:
- Understand Market Behavior: By studying the proportion and sequence of up, down, and no change intervals, users can gauge overall market sentiment and volatility.
- Develop Strategies: The insights from consecutive interval analysis can guide the development of strategies that capitalize on observed market trends.
- Manage Risk: Understanding the frequency and extent of price movements helps in setting more informed stop-loss orders and anticipating potential reversals.
Up Intervals
In the Data Analysis - Trend Change Analysis module of FinStudio, a detailed focus on Up Intervals Data allows traders and analysts to gain insights into bullish trends and their persistence. This section of the module is crucial for understanding the dynamics of price movements, particularly the continuity of upward trends.
Understanding Up Intervals Data
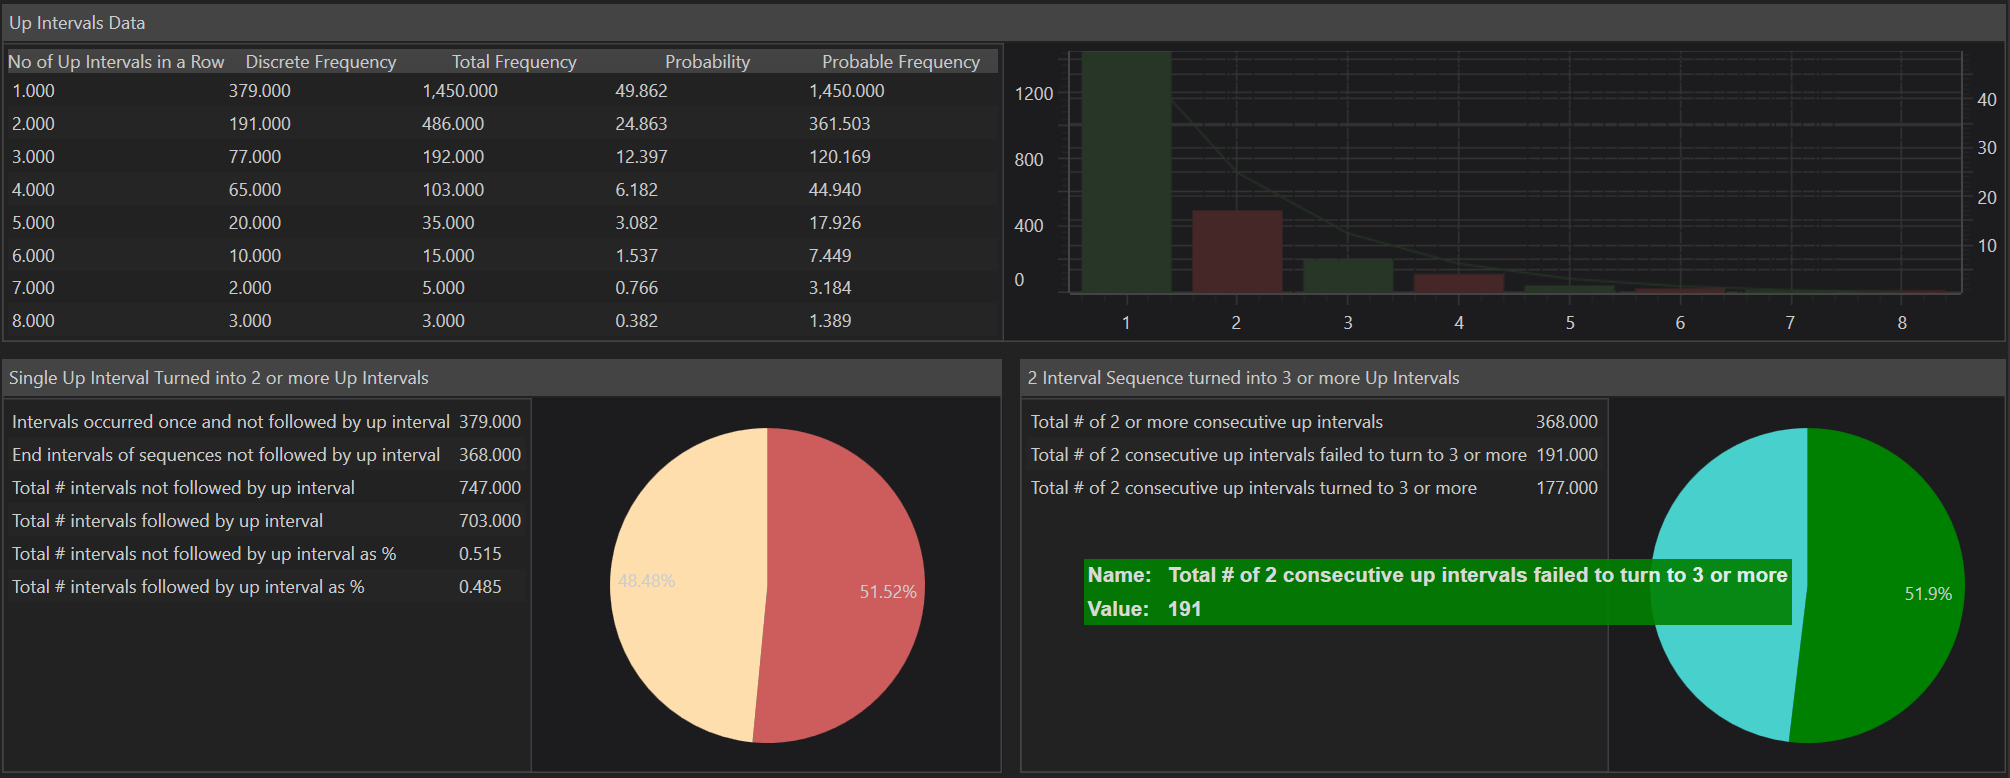
Number of Up Intervals in a Row: This metric tracks consecutive intervals where the market closed higher than it opened, indicating continuous upward movement. The system records as many entries as the maximum number of consecutive up intervals identified. For instance, if the maximum consecutive up intervals are six, the system will track from one up interval in a row to six up intervals in a row.
Detailed Frequency Analysis
-
Discrete Frequency: Indicates the number of times specific consecutive up intervals appear in the dataset without being part of a longer sequence. For example, a count of single up intervals that do not form part of sequences containing two or more consecutive up intervals.
-
Total Frequency: Represents the count of specific consecutive up intervals, including those that form part of longer sequences. For example, three consecutive up intervals can include three instances of one up interval and one instance of two consecutive up intervals.
-
Probability: This measures the likelihood of encountering a specific sequence of consecutive up intervals within the data.
-
Probable Frequency: Estimates how often a particular sequence of consecutive up intervals is likely to occur within the total dataset.
Analysis of Transition Between Consecutive Up Intervals
Single Up Intervals Turned into 2 or More Up Intervals: This analysis is vital for understanding the momentum within the market:
-
Intervals Occurred Once and Not Followed by an Up Interval: Counts the number of single intervals that did not lead to a new up interval, highlighting instances where upward momentum paused.
-
End Intervals of Sequences Not Followed by an Up Interval: Totals the number of sequences that did not continue with another up interval, providing insight into where upward trends stalled.
-
Total Number of Intervals Not Followed by an Up Interval: Combines all instances of up intervals that did not continue with a subsequent up interval, offering a broader view of how often upward momentum halts.
-
Total Number of Intervals Followed by an Up Interval: Counts all sequences where one up interval led directly to another, indicative of strong bullish momentum.
-
Total # of intervals not followed by up interval as %:-This is a percent of total number of Up Intervals not followed by a new Up interval to the total number of Intervals.
-
Total # of intervals followed by up interval as %: This is a percent of total number of Up Intervals followed by a new Up interval to the total number of Intervals.
-
Percentage Metrics: These calculate the proportions of up intervals that did or did not lead to further up intervals, offering a statistical view of the persistence of upward trends.
Practical Application
This detailed analysis helps traders and analysts:
-
Identify Trend Stability: Understanding the frequency and probability of consecutive up intervals helps in assessing the stability and potential continuation of bullish trends.
-
Strategize Entries and Exits: By analyzing where up intervals typically stall or continue, traders can better plan their entry and exit points to capitalize on persistent trends or avoid potential reversals.
-
Quantitative Risk Assessment: Knowing the likelihood of transitions between consecutive up intervals aids in quantitative risk management, allowing traders to set more informed stop-loss orders based on historical trend persistence.
Down Intervals
In FinStudio's Data Analysis - Trend Change Analysis module, the Down Intervals Data segment offers a detailed exploration of bearish market trends by examining sequences of downward movements. This analysis is essential for traders and analysts who focus on identifying and understanding bearish trends, allowing for effective risk management and strategy development.
Overview of Down Intervals Data
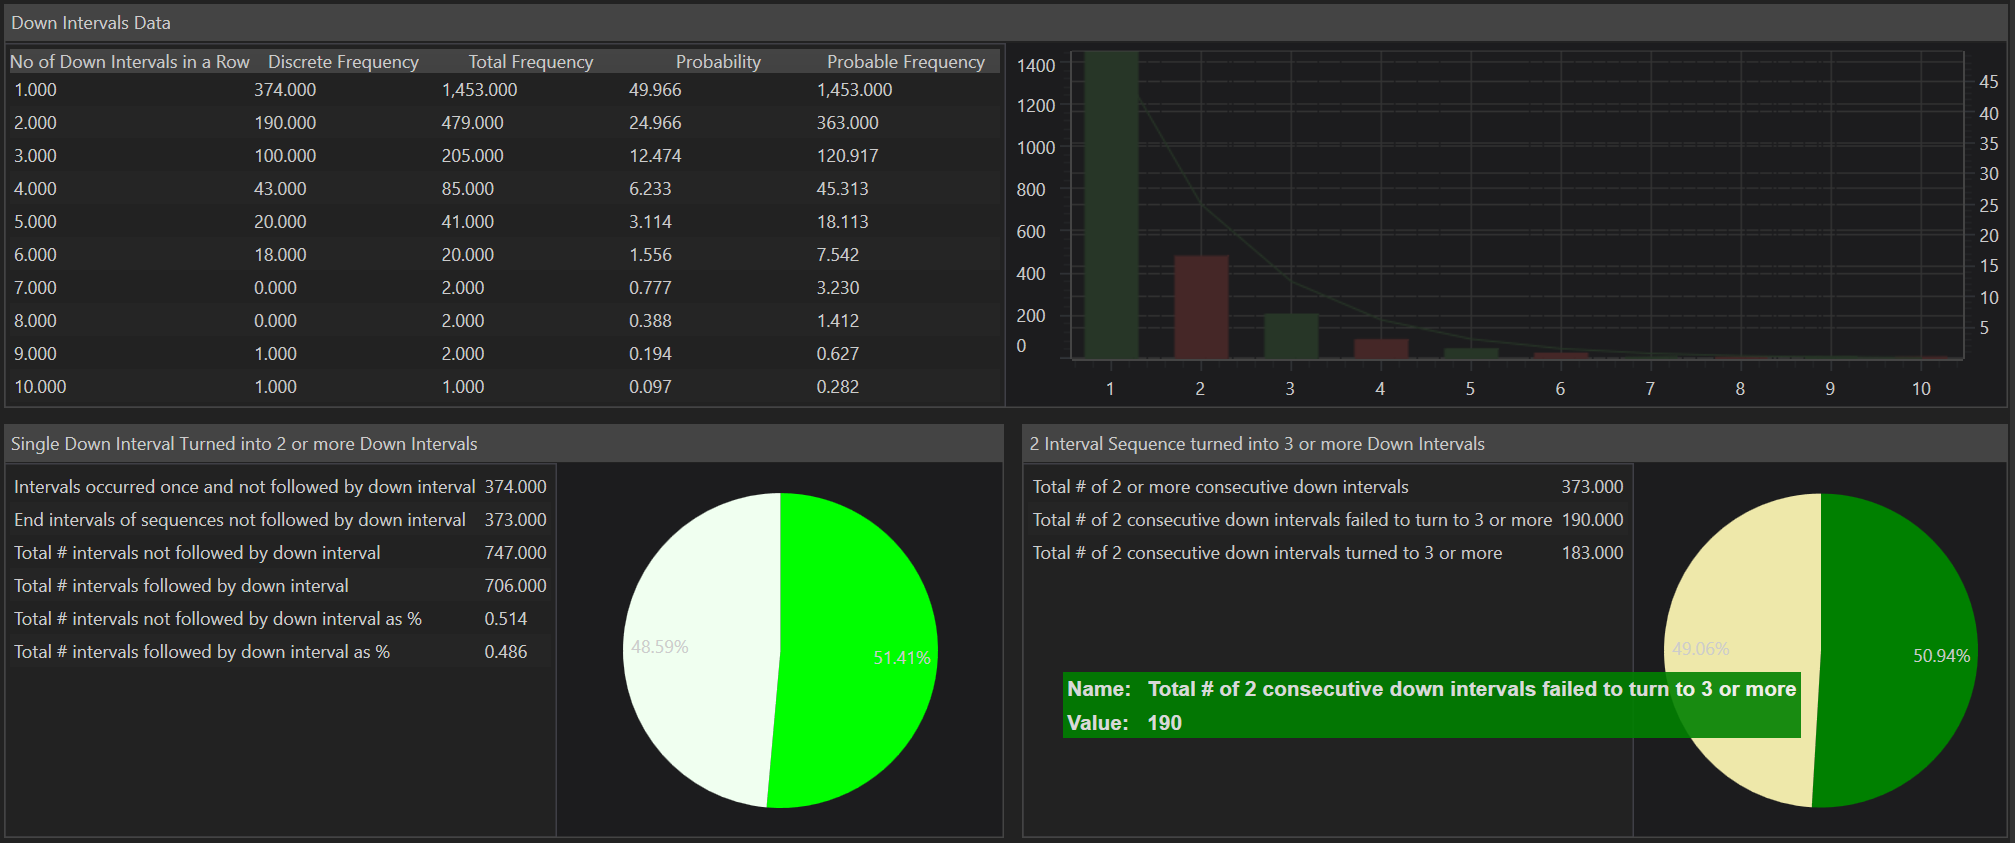
Number of Down Intervals in a Row: This metric captures sequences of consecutive intervals where the market closed lower than it opened, reflecting sustained downward trends. The system records this data up to the maximum consecutive down intervals identified. For example, if the maximum is six consecutive down intervals, there will be records from one down interval in a row to six down intervals in a row.
Detailed Frequency Analysis
-
Discrete Frequency: Indicates the count of specific sequences of consecutive down intervals that appear independently within the data, without being part of longer sequences. This metric helps in understanding the frequency of isolated bearish movements.
-
Total Frequency: Represents the total occurrences of specific sequences of consecutive down intervals, including those that are part of longer sequences. This provides a comprehensive view of all bearish trends within the dataset.
-
Probability: Measures the likelihood of encountering various sequences of consecutive down intervals within the data, offering predictive insights into bearish trends.
-
Probable Frequency: Estimates the expected frequency of each sequence of down intervals occurring within the total dataset, aiding in probability assessments and risk analysis.
Analysis of Transition Between Consecutive Down Intervals
Single Down Intervals Turned into 2 or More Down Intervals: This section delves into the momentum and continuation of bearish trends:
-
Intervals Occurred Once and Not Followed by a Down Interval: Counts the number of single down intervals that did not lead to subsequent down intervals, indicating pauses or reversals in bearish momentum.
-
End Intervals of Sequences Not Followed by Down Interval: Totals sequences of down intervals that concluded without being followed by another down interval, useful for identifying potential bottoms or trend exhaustion points.
-
Total Number of Intervals Not Followed by Down Interval: Combines all instances where a down interval did not lead to another, providing a broader perspective on the interruption of bearish trends.
-
Total Number of Intervals Followed by Down Interval: Counts all sequences where one down interval directly led to another, indicative of strong and sustained bearish momentum.
-
Total # of intervals not followed by down interval as %: This is a percent of total number of Down Intervals not followed by a new Down interval to the total number of Intervals.
-
Total # of intervals followed by down interval as %: This is a percent of total number of Down Intervals followed by a new Down interval to the total number of Intervals.
Practical Application
The detailed statistical analysis provided within the Down Intervals Data segment of FinStudio's module is invaluable for:
-
Identifying Trend Persistence: By quantifying how often and for how long prices move downward, traders can better anticipate further declines and manage their positions accordingly.
-
Enhancing Trading Strategies: Understanding the patterns and probabilities of consecutive down intervals helps traders refine short-selling strategies or determine optimal points for buying dips.
-
Risk Management: Knowing the frequency and extent of price declines aids in setting more precise stop-loss orders based on historical bearish persistence.