Viewing and Editing Data
The Instruments module in FinStudio is meticulously designed to provide users with robust tools for both viewing and editing data pertaining to specific financial instruments. This module ensures that users can easily access and modify data to enhance their trading analysis and strategy implementation.

Viewing Data
To begin the data viewing process, users must perform the following steps:
- Select the Instrument: Choose the specific financial instrument for which data is needed from the list available in the Instruments module.
- Specify the Period: Determine the historical period that the user wishes to analyze.
- Choose the Interval: Select the specific time interval (e.g., minute, hour, day) that is relevant to the analysis.
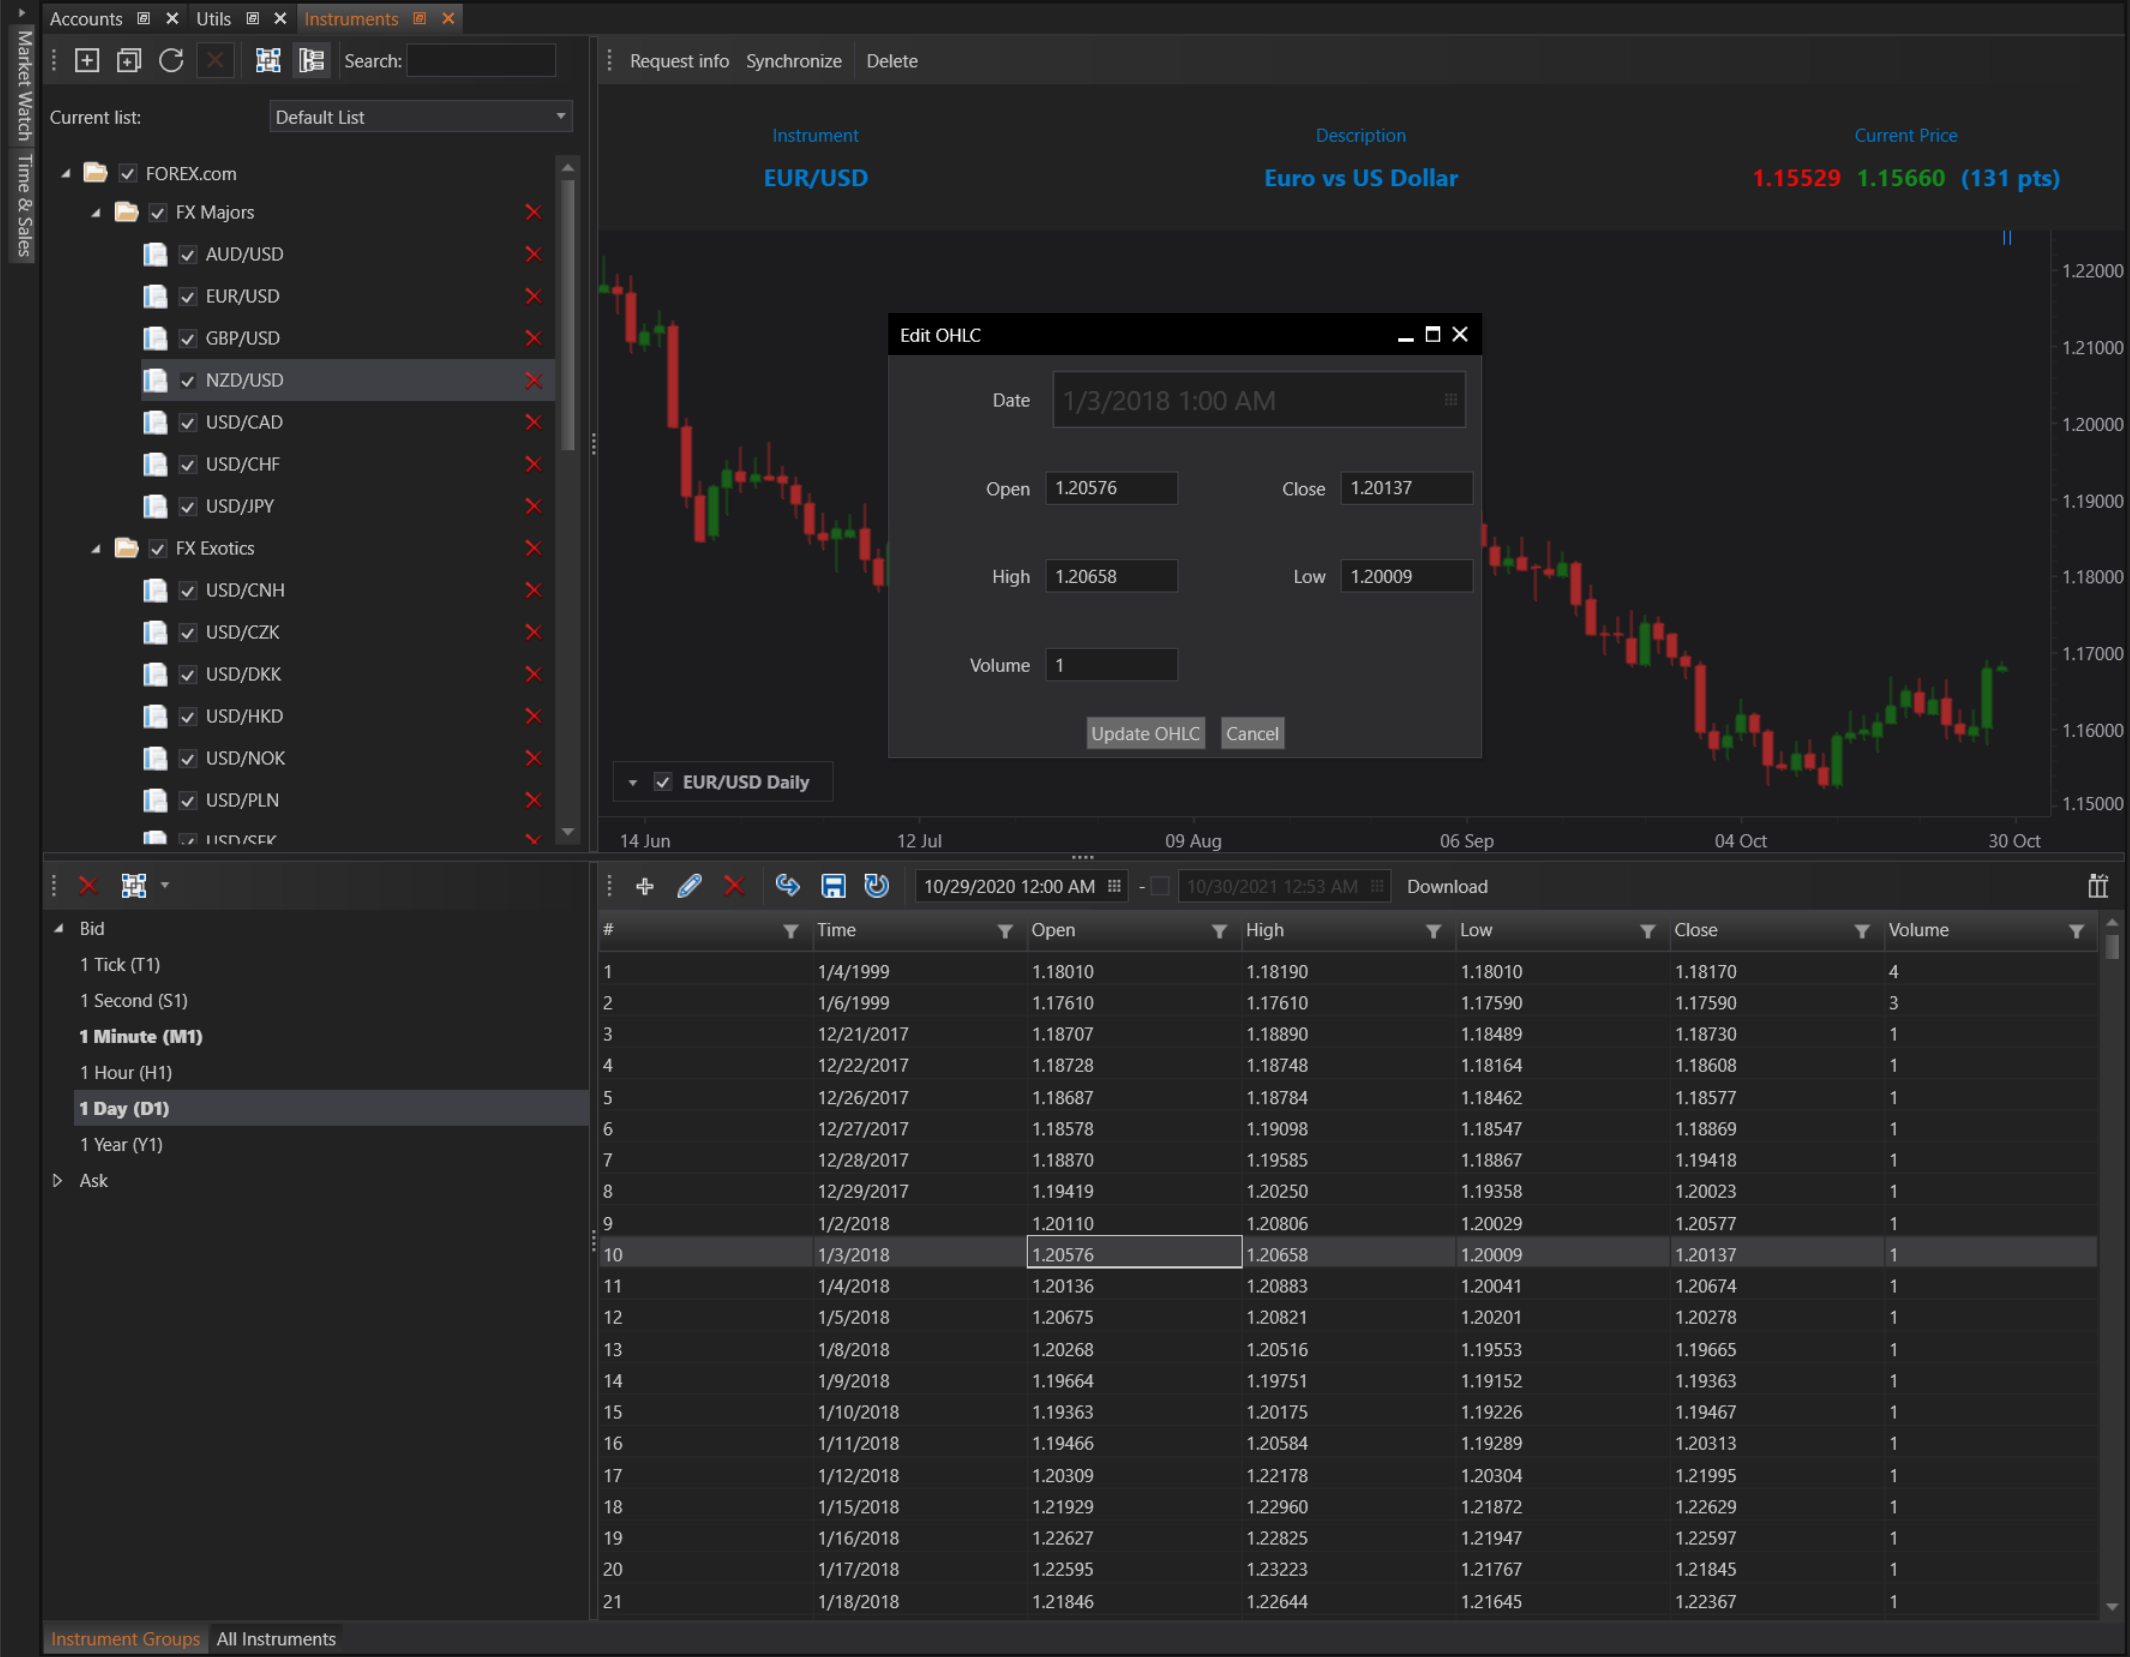
Once these selections are made, the relevant data for the chosen instrument and specified period will be displayed in a data preview grid within the module. This grid serves as a central point for users to overview and access the data they need efficiently.
Chart Integration
When a user selects a specific interval from the data preview grid, that interval is automatically projected onto an integrated chart within the same module. This functionality enables users to perform visual analysis seamlessly. The chart dynamically updates to reflect the data points selected in the grid, providing an immediate visual representation of the data trends and patterns over the selected interval.
Editing Data
In addition to viewing data, the Instruments module also allows for the editing of records within existing intervals. This editing capability is crucial for users who need to adjust or correct data post-importation. Whether it’s updating incorrect values, adjusting for anomalies, or refining data points for better accuracy, the edit feature provides the necessary flexibility.
Steps to edit data:
- Access the Data Grid: Within the data preview grid, navigate to the interval or data point that requires modification.
- Edit Records: Directly modify the data fields such as open, high, low, close, and volume within the grid.
- Save Changes: After making the necessary edits, save the changes to ensure the updated data is reflected in future analyses and charting.
This functionality is especially beneficial for users who integrate data from various sources, which may require normalization or corrections to align with their analytical frameworks.
Overall, the viewing and editing functionalities within the Instruments module of FinStudio provide users with comprehensive control over their financial data.