The Indicators section within the Scripts module of FinStudio allows users to browse, manage, and utilize various types of indicators written in FinScript. This section is organized into three primary folders: Custom, Samples, and Standard.
Custom Indicators
The Custom folder is designated for user-created indicators. These indicators are developed based on individual trading strategies and specific needs of the user.
Samples Indicators
The Samples folder contains example indicators that serve as demonstrations of how indicators can be used and customized within FinStudio. These sample indicators provide a practical guide for users to understand the capabilities of FinScript in creating various technical analysis tools. The list of sample indicators includes:
- Candlestick Patterns
- Chart Objects Demo
- Collections Demo
- Colored Bars Demo
- Custom Historical Data Demo
- Custom Instrument RSI Demo
- Custom Rendering Demo
- Custom Scale Demo
- Custom Timeframe SMA Demo
- Invalid State Label Demo
- Market Data Demo
- Nested Properties Demo
- Non-visual Indicator
- Plot Properties Demo
- Plots: Column Demo
- Plots: Custom Colors Demo
- Plots: Segment Line Demo
- Scan All Indicators
- Serialization Demo
- Series-based Indicator Demo
- Timer Demo
- Trade Simulation Demo
- Type Converters Demo
Standard Indicators
The Standard folder includes the default set of indicators provided to users. These indicators cover a broad range of technical analysis tools and are commonly used in trading. The list of standard indicators includes:
- Account Equity and Balance
- ADL
- ADX
- ADXR
- APZ
- Aroon
- Aroon Oscillator
- ATR
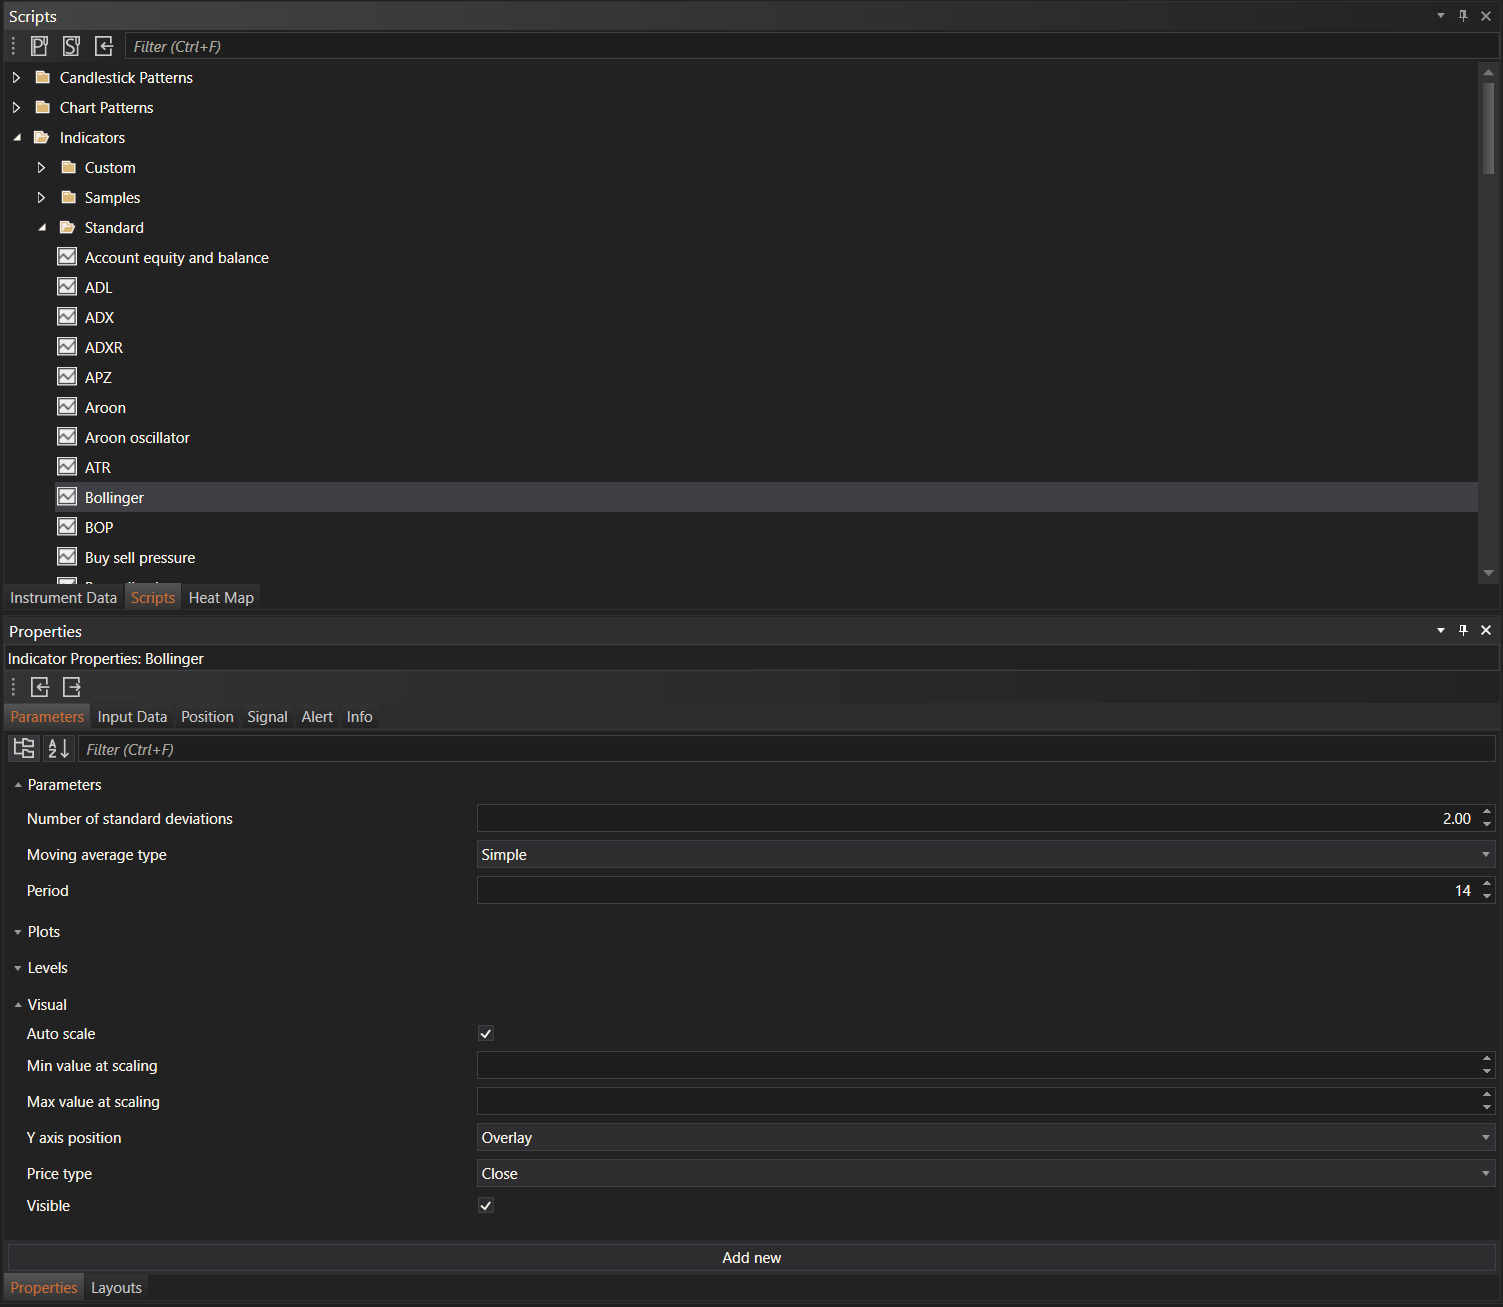
- Bollinger
- BOP
- Buy Sell Pressure
- Buy Sell Volume
- Candlestick Pattern
- CCI
- Chaikin Money Flow
- Chaikin Oscillator
- Chaikin Volatility
- CMO
- Constant Lines
- Current Day OHLC
- Darvas
- DEMA
- DM
- DM Index
- DMI
- Donchian Channel
- Double Stochastics
- Ease of Movement
- EMA
- Fisher Transform
- High/Low Trend
- HMA
- KAMA
- Keltner Channel
- Key Reversal Down
- Key Reversal Up
- Linear Regression
- LWMA
- MA Envelopes
- MACD
- MAMA
- MAX
- MFI
- MIN
- Momentum
- N Bars Down
- N Bars Up
- OBV
- Parabolic SAR
- PFE
- PPO
- Price Oscillator
- Prior Day OHLC
- R Squared
- Range
- Regression Channel
- ROC
- RSI
- RSS
- RVI
- Sessions
- SMA
- Standard Deviation
- Stoch RSI
- Stochastics
- SUM
- Super Trend
- Swing
- T3
- TEMA
- TMA
- TRIX
- TSI
- Ultimate Oscillator
- VMA
- VOL
- VOLMA
- Volume Oscillator
- Volume Up Down
- VROC
- VWMA
- Wilder's Moving Average
- Williams %R
- Zig Zag
- ZLEMA
Interaction and Features
In the Scripts module, indicators can be easily browsed through the organized folder structure. Users can drag and drop these indicators onto their charts for immediate analysis. Clicking on a specific indicator in the Scripts explorer will display its settings in the Properties module, where users can customize the indicator’s parameters according to their trading strategies.
In summary, the Indicators section within the Scripts module is an essential part of FinStudio, providing users with a wide range of pre-built and customizable indicators to enhance their technical analysis and trading decisions.