The Market Heatmap in FinStudio is a visually intuitive tool designed to provide a snapshot of market activity across various instruments by displaying them in a color-coded and size-variable format. This allows traders to quickly grasp which instruments are experiencing the most significant changes over a selected period, helping them identify trends and anomalies in the market.
Key Features of the Market Heatmap
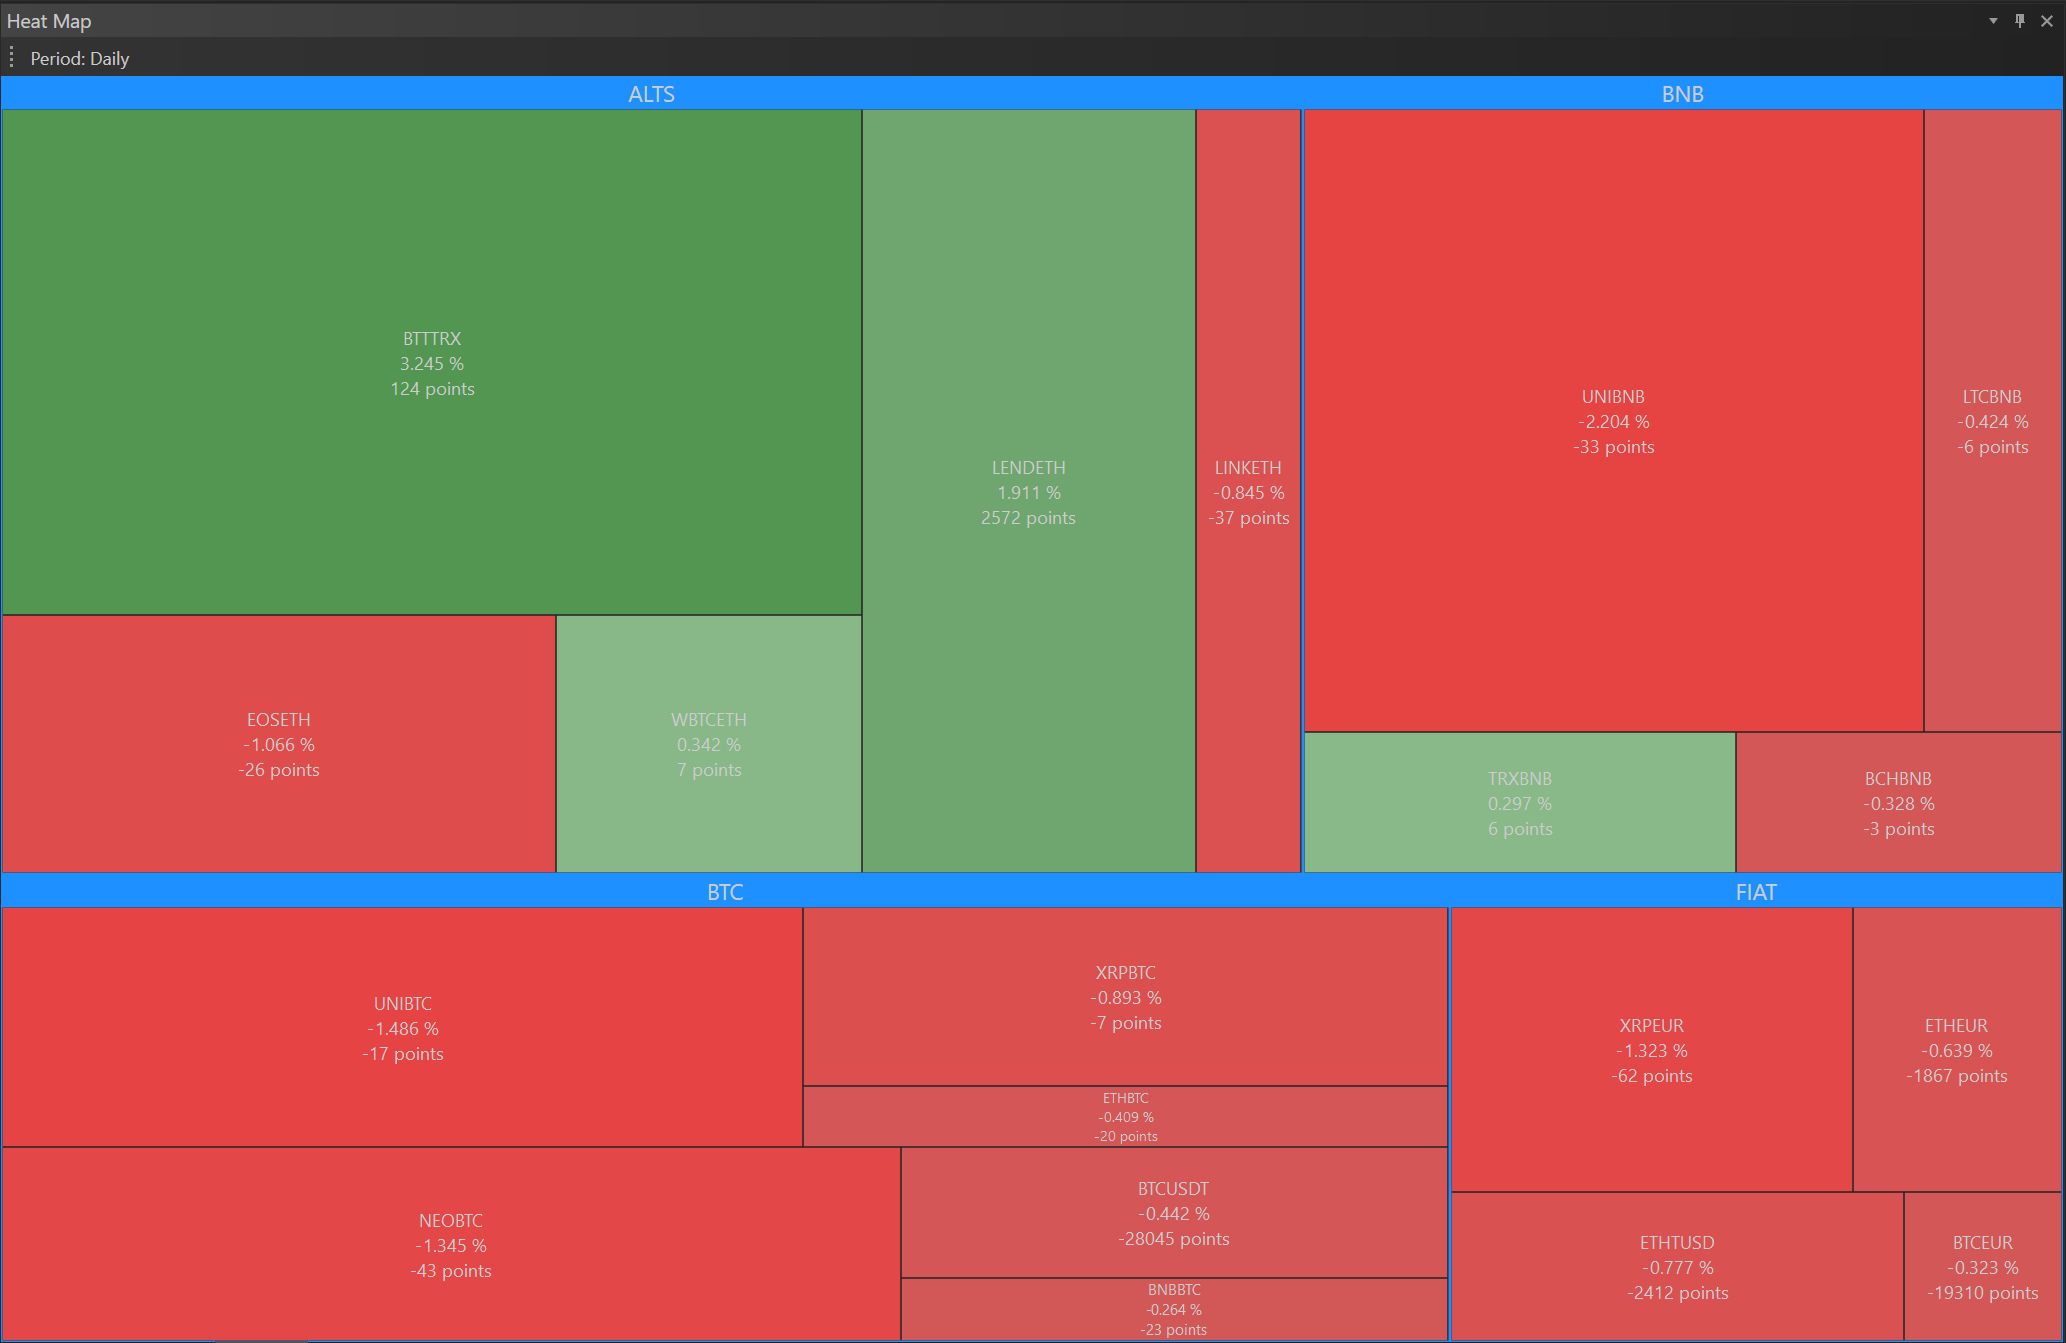
Block Size and Color
- Configuration Options:
- Price Change: Blocks vary in size based on the magnitude of their price change. Larger blocks indicate more substantial price changes, making it easy to spot the most volatile instruments.
- Price Range: Another option is to set the block size according to the price range (the difference between high and low prices within the selected period).
- Volume: Alternatively, block size can reflect trading volume, with larger blocks representing higher volumes.
- Color Settings:
- The color of each block can be adjusted to reflect the nature of the change. For example, a green gradient may represent positive changes or growth, while a red gradient could indicate negative changes or declines.
- This color coding adds an additional layer of quick visual analysis, as traders can see at a glance which instruments are performing well and which are not.
Timeframe and Period
- Customizable Period: Traders can select the specific timeframe for the heatmap analysis, ranging from short periods like the last hour to much longer spans like the past 10 years.
- Application: This flexibility allows traders to view market dynamics over different historical periods, aiding in both short-term trading and long-term investment decisions.
Refresh Interval
- Adjustable Refresh Rate: In the Properties settings, traders can set the refresh interval in seconds, determining how frequently the heatmap updates.
- Real-Time Insights: Setting a shorter refresh interval provides near real-time insights into market movements, which is particularly useful in highly volatile trading environments.
Benefits of Using the Market Heatmap
- Efficient Overview: The heatmap provides a quick and efficient overview of large datasets, allowing traders to assess market conditions without the need to examine each instrument individually.
- Visual Analysis: By using visual tools like size and color gradients, traders can more easily digest complex information, which can enhance decision-making processes.
- Adaptability: The ability to customize the timeframe, period, and refresh rate makes the heatmap a versatile tool suitable for various trading strategies and analysis needs.
Practical Application
Imagine a scenario where a trader is monitoring the cryptocurrency market during a period of high volatility. By setting the Market Heatmap to reflect price changes over the last hour and adjusting the refresh interval to a few seconds, the trader can quickly identify which cryptocurrencies are experiencing the most significant fluctuations. This information could be crucial for making prompt buy or sell decisions based on emerging trends.