The Custom Columns feature within FinStudio's Market Watch module offers an extensive level of customization, allowing users to tailor the financial data they monitor to precisely fit their trading strategies and preferences. This flexibility is instrumental in optimizing the utility and efficiency of the trading dashboard.
Capabilities of Custom Columns
Versatile Data Options: Users can create columns that display a variety of financial data types, including:
- Basic Market Metrics: Such as open, high, low, and close prices.
- Volatility and Changes: Tracking changes in percentage or points, and the range of price movements within specified intervals.
- Volume Information: Reflecting the trading volume for given periods to assess market activity levels.
Integration of Technical Indicators: One of the standout features of custom columns is the ability to incorporate technical indicators directly into the Market Watch. This allows users to:
- Monitor Trends: For example, setting up a column to display a moving average or an RSI directly next to the price data, providing immediate insights into potential overbought or oversold conditions.
- Customize Timeframes: Whether it’s viewing short-term fluctuations or analyzing long-term trends, users can specify the exact timeframe and period for the data shown in each column, enhancing the relevance of the data displayed.
Enhanced Analytical Depth: By enabling the customization of columns to include specific data points and indicators, traders can:
- Spot Patterns: Easily identify key price levels and historical performance trends without the need for additional tools or switching screens.
- React Quickly: Having all necessary data in one view allows for faster decision-making, which is crucial in volatile market environments.
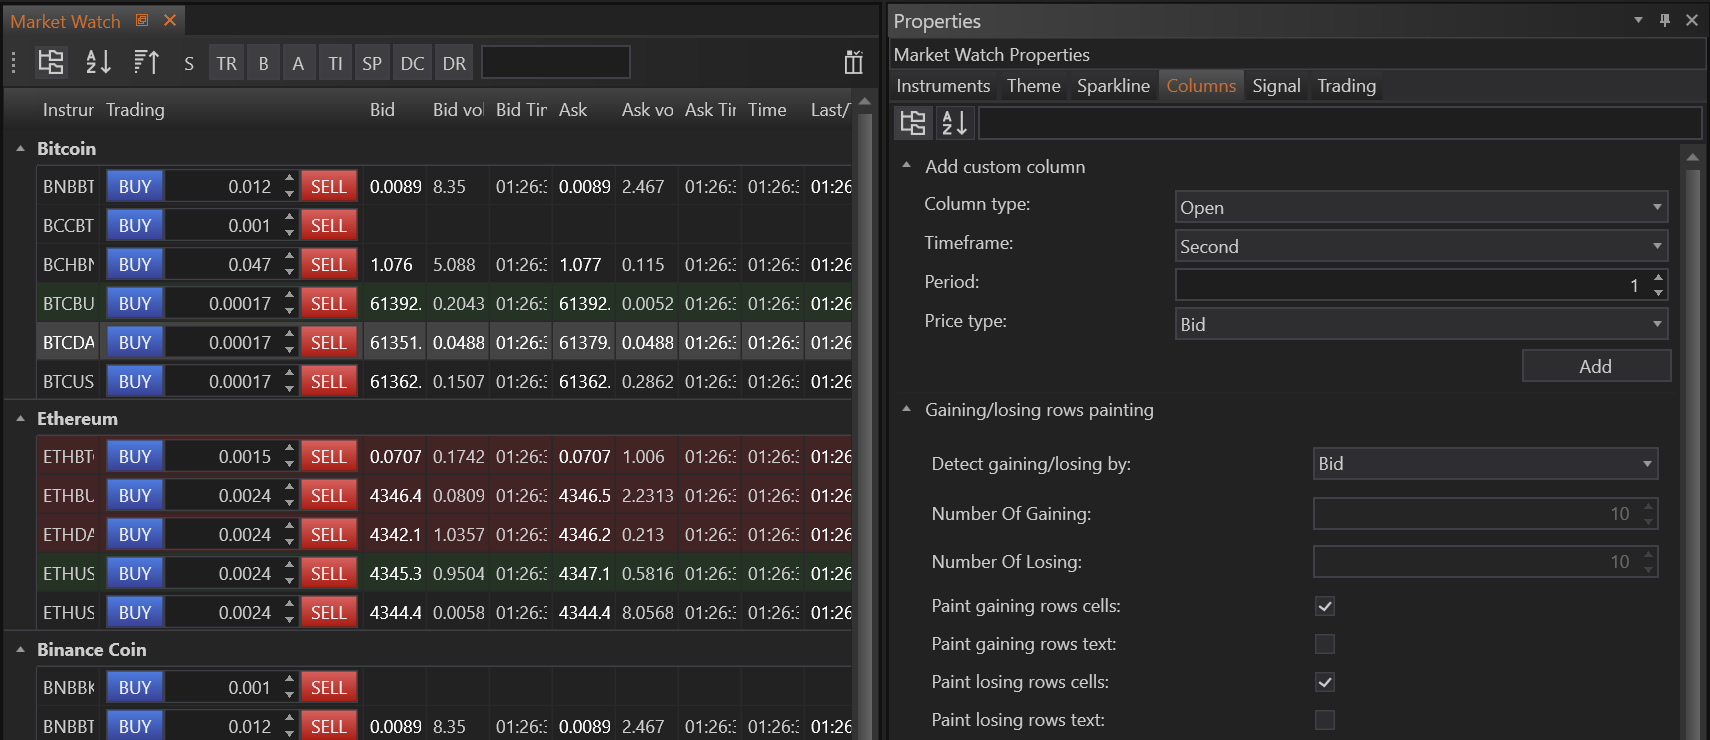
Configuration Options
Column Type:
- Open: Displays the opening price of the interval.
- High: Shows the highest price within the interval.
- Low: Indicates the lowest price within the interval.
- Close: Provides the closing price of the interval.
- Change in Percent: Reflects the percentage change in the instrument's price over the interval.
- Change in Points: Shows the point change in the instrument's price over the interval.
- Range: The difference between the high and low prices for the interval.
- Volume: The trading volume during the interval.
- Indicator: Users can choose to display values of specific indicators calculated for the interval, such as moving averages.
- Signal: Allows for the configuration of trading signals based on certain criteria met within the interval.
Timeframe:
- Users can select from various timeframes for their data column, ranging from ticks to years (Tick, Second, Minute, Hour, Day, Week, Month, Year), allowing them to view data in a format that best suits their trading strategy.
Period:
- An input field is provided for users to specify the exact period over which they want to analyze the data, offering flexibility in how historical or recent the data should be.
Price Type:
- Bid: Uses the bid price for calculations and displays.
- Ask: Uses the ask price for calculations and displays.
- Last: Uses the last traded price for calculations and displays.
How to Set Up Custom Columns
Step-by-Step Configuration:
-
Accessing Custom Columns: To begin creating a custom column, users should navigate to the Market Watch Properties and select the Columns tab. This is where all column customization begins.
-
Choosing Column Type: Users have the freedom to define the type of data each column should display. Options include:
- Basic Market Data: Open, High, Low, Close
- Changes: Change in Percent, Change in Points
- Range: Range for a specified period
- Volume: Trading volume during the interval
- Indicators: Any technical indicator, such as a Moving Average
-
Selecting Timeframe and Period: Custom columns can be configured for any timeframe — from tick data to yearly aggregates. Users can specify the period, adapting the column to show data ranging from a single day to multiple weeks or months, thus accommodating short-term analyses as well as long-term trends.
-
Indicator Configuration: For columns based on indicators, users can select which indicator to apply, set the applicable timeframe, and define the period. For example, to view a 200-day Moving Average based on daily closing prices, one would set the indicator to 'Moving Average', select 'Day' for the timeframe, and enter '200' for the period.
Practical Applications
-
Weekly Range Example: A user can easily set up a column to display the range of an instrument over the past three weeks by selecting 'Range' as the column type, 'Week' as the timeframe, and '3' as the period.
-
Indicator Example: To monitor a 200-day Moving Average on a daily chart directly within the Market Watch, users can configure the column to calculate and display this specific indicator value, ensuring continuous observation of key market trends.
Practical Utility
- Scenario-Specific Columns: Traders can set up columns to show the data most relevant to their trading scenario, such as intraday highs and lows for day traders or weekly volume summaries for swing traders.
- Event-Driven Data Configuration: Before major economic releases or earnings announcements, columns can be adjusted to highlight anticipated price and volume movements, helping traders prepare for potential market reactions.
- Enhanced Market Insights: Tailoring columns to specific needs allows traders to focus on the data that matters most to them, enhancing their ability to detect market opportunities and trends.