The Predefined Columns section in FinStudio's Market Watch module is expertly crafted to provide traders with a comprehensive and customizable interface for monitoring financial market data. This section ensures traders have the necessary tools to assess market data efficiently and make informed decisions.
Overview of Predefined Columns
FinStudio supports up to 60 predefined columns, allowing users to access and analyze a wide array of market data:
- Extensive Data Availability: Displays critical market metrics such as instrument names, bids, asks, last prices, volume, and timing of transactions.
- Advanced Visualization Options: Users can enable displays of instrument spreads and sparklines, enhancing the ability to visually track price movements and trends.
- Expanded Metrics: The module includes detailed data like open, high, low, close, volume changes, points and percent changes, alongside ranges for various periods—daily, weekly, monthly, 3 months, 6 months, yearly, and all-time.
Default Column Layout
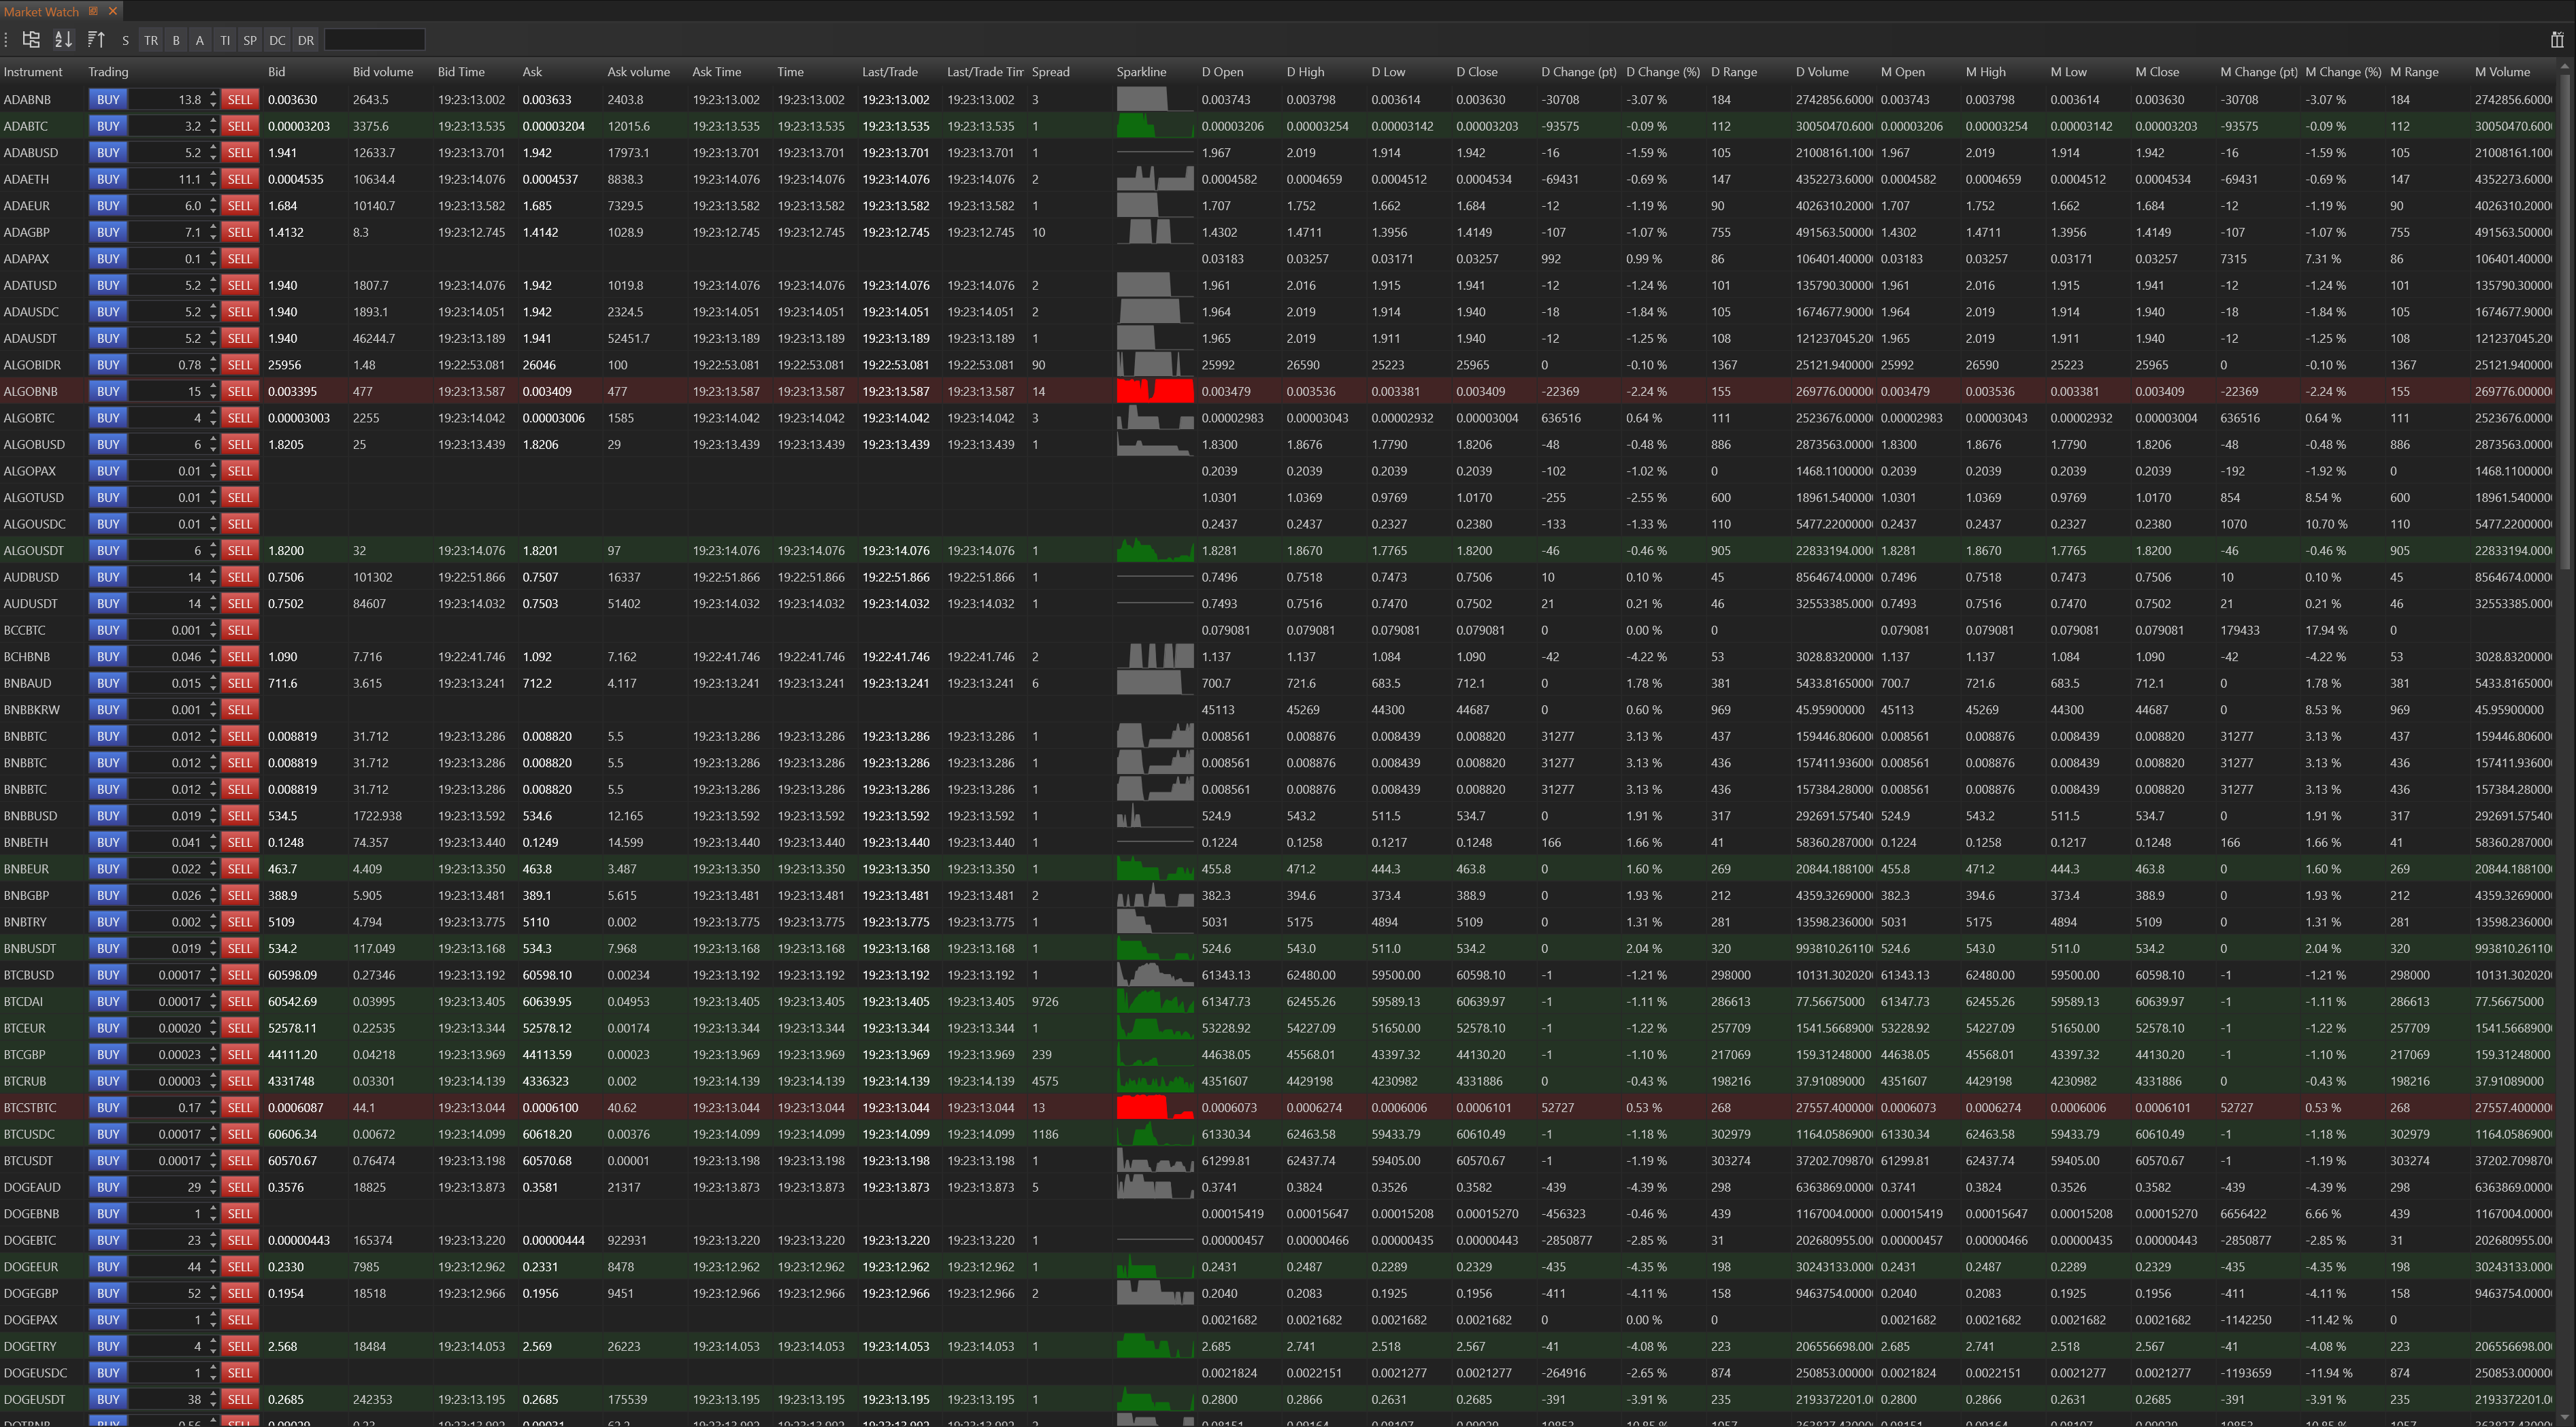
Here is the default layout of the predefined columns in the Market Watch module, providing a structured and detailed overview of financial instruments:
| Instrument | D Open | W Open | M Open | Y Open | All Time Open |
|---|---|---|---|---|---|
| Trading | D High | W High | M High | Y High | All Time High |
| Bid | D Low | W Low | M Low | Y Low | All Time Low |
| Bid Volume | D Close | W Close | M Close | Y Close | All Time Close |
| Bid Time | D Change (pt) | W Change (pt) | M Change (pt) | Y Change (pt) | All Time Change (pt) |
| Ask | D Change (%) | W Change (%) | M Change (%) | Y Change (%) | All Time Change (%) |
| Ask Volume | D Range | W Range | M Range | Y Range | All Time Range |
| Ask Time | D Volume | W Volume | M Volume | Y Volume | All Time Volume |
| Time | 3M Change (pt) | ||||
| Last/Trade | 3M Change (%) | ||||
| Last/Trade Time | 3M Range | ||||
| Spread | 6M Change (pt) | ||||
| Sparkline | 6M Change (%) | ||||
| 6M Range |
Customization and Utility
The Market Watch module’s flexibility allows traders to tailor the information display to fit their specific needs, enhancing both the efficiency and effectiveness of their market monitoring:
- Risk Management: Viewing changes and ranges across different periods aids traders in setting precise stop-loss orders based on historical volatility.
- Opportunity Identification: Access to both real-time and historical data enables traders to identify potential trading opportunities by observing patterns or significant price changes.