The Pattern Statistical Analysis section of the Scanner module provides comprehensive statistics and insights into the performance and behavior of various candlestick patterns. Below is an explanation of each section and term used in this analysis, based on definitions from Bulkowski's "Encyclopedia of Candlestick Charts."
Sections and Terms
-
Pattern Section
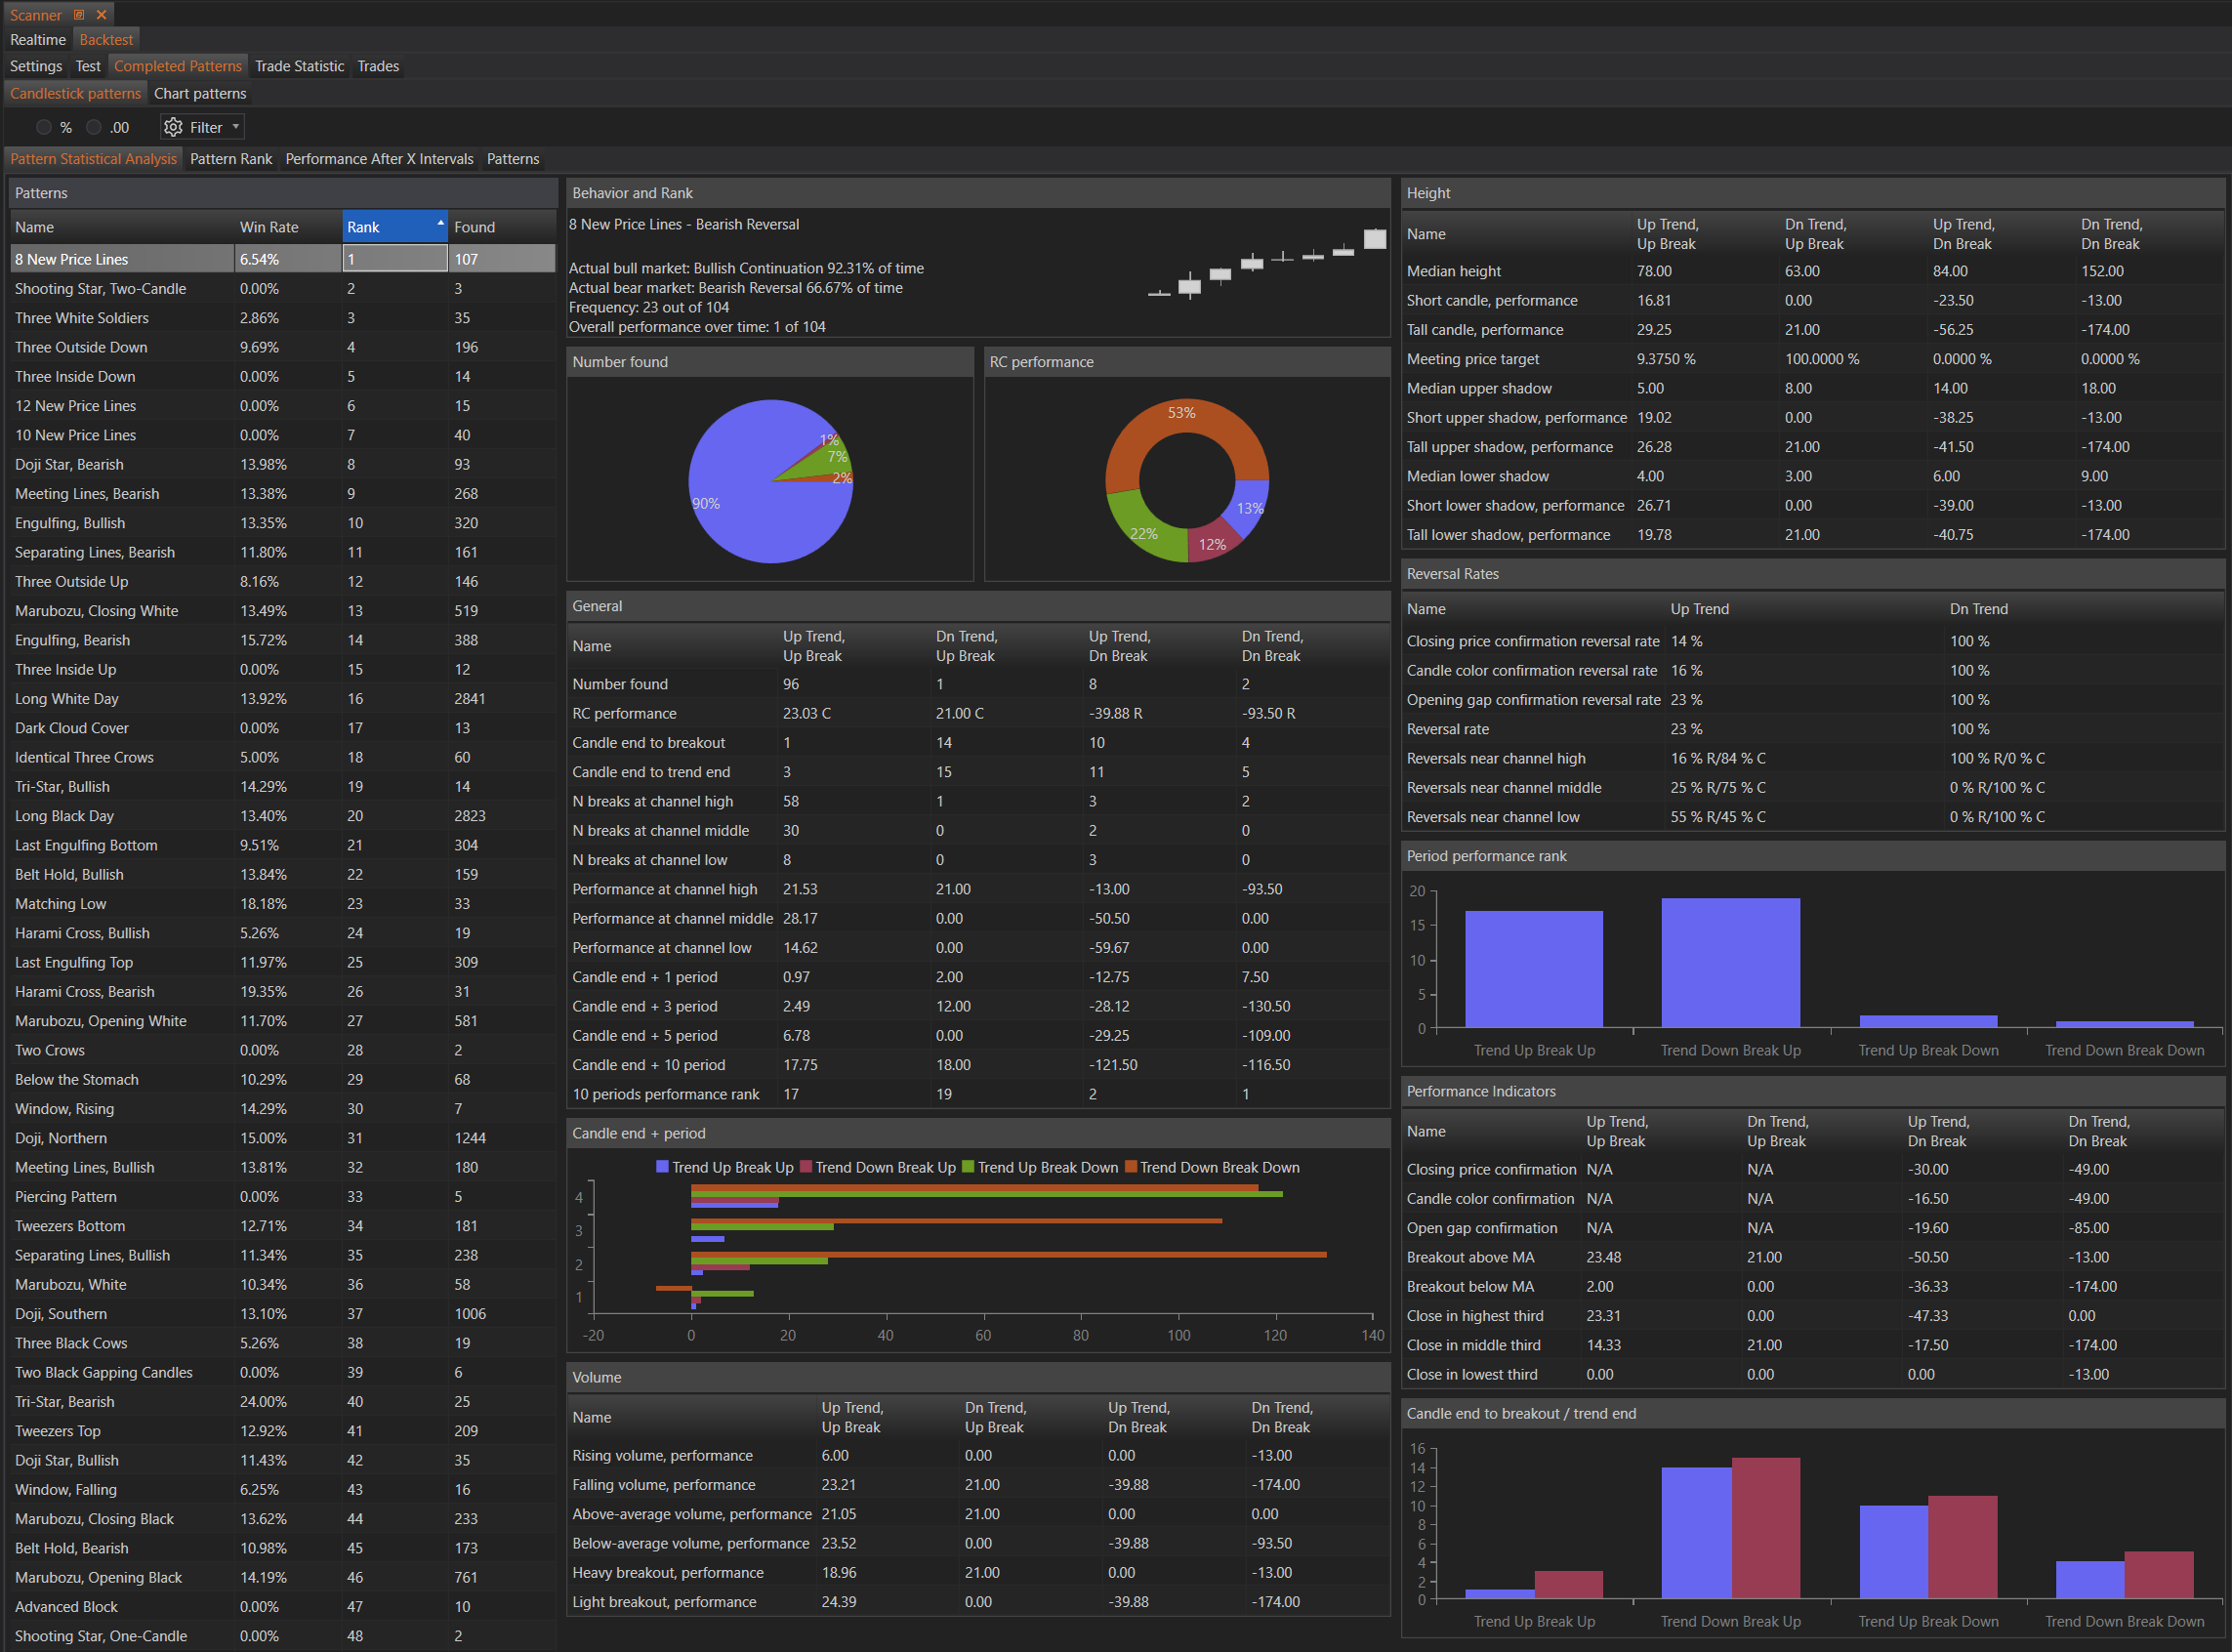
- Patterns: The list of candlestick patterns analyzed, such as "8 New Price Lines," "Shooting Star, Two-Candle," etc.
- Win Rate: The percentage of time the pattern results in a profitable trade.
- Rank: The overall performance rank of the pattern based on various metrics.
- Found: The total number of times the pattern was found in the historical data set.
- Patterns: The list of candlestick patterns analyzed, such as "8 New Price Lines," "Shooting Star, Two-Candle," etc.
-
Behavior and Rank
- Theoretical: Expected behavior (bullish, bearish, reversal, continuation, or indecision) according to published sources.
- Actual Bull Market: Observed behavior in a bull market, showing the percentage of occurrences as continuations or reversals among all similar candles in the bull market. Ranked among 103 candle types.
- Actual Bear Market: Same as the bull market but applies to a bear market.
- Frequency: The rank showing how often a candle pattern appears in the standard database.
- Overall Performance Over Time: A ranked sum of performance over time in all categories. See "Overall Rank" for a detailed definition.
- Theoretical: Expected behavior (bullish, bearish, reversal, continuation, or indecision) according to published sources.
-
General Statistics
- Number Found: Total count of the specific candlestick patterns used in the statistics.
- RC Performance (Reversal/Continuation): Average rise or decline from breakout to trend end for reversals and continuations.
- Candle End to Breakout: The median number of timeframe intervals between the end of the candle pattern and the breakout.
- Candle End to Trend End: The median number of timeframe intervals between the end of the candle pattern and the trend end.
- Breakouts in Channel (High, Middle, Low): Number of candle patterns breaking out near the yearly high, middle, or low.
- Performance Over 1-10 Periods: The average price move from the closing price of the candle pattern end to 1, 3, 5, or 10 timeframe intervals later.
- 10 Periods Performance Rank: A rank of the sum of percentage price changes over 1, 3, 5, and 10 timeframe intervals for each category compared to other candle types.
- Number Found: Total count of the specific candlestick patterns used in the statistics.
-
Height Statistics
- Median Candle Height as Percentage of Breakout Price: The median height from the highest high to the lowest low in the candle pattern, divided by the breakout price.
- Short Candle, Performance: Average rise/decline for patterns equal to or shorter than the median height.
- Tall Candle, Performance: Average rise/decline for patterns taller than the median height.
- Percentage Meeting Price Target (Measure Rule): The percentage of candle patterns where the price reaches or exceeds the predicted target using the measure rule.
- Median Upper Shadow as Percentage of Breakout Price: Median height of the upper shadow as a percentage of the breakout price.
- Short Upper Shadow, Performance: Average performance for patterns with upper shadows shorter than or equal to the median.
- Tall Upper Shadow, Performance: Average performance for patterns with upper shadows taller than the median.
- Median Lower Shadow as Percentage of Breakout Price: Median height of the lower shadow as a percentage of the breakout price.
- Short Lower Shadow, Performance: Average performance for patterns with lower shadows shorter than or equal to the median.
- Tall Lower Shadow, Performance: Average performance for patterns with lower shadows taller than the median.
- Median Candle Height as Percentage of Breakout Price: The median height from the highest high to the lowest low in the candle pattern, divided by the breakout price.
-
Volume Statistics
- Rising/Falling Candle Volume, Performance: Average performance based on whether volume is rising or falling from the start to end of the candle pattern.
- Above/Below-Average Candle Volume, Performance: Average performance comparing the candle's volume to the average volume over the prior 21 trading timeframe intervals.
- Heavy/Light Breakout Volume, Performance: Average performance comparing breakout- timeframe intervals volume to the average volume leading to the candle pattern.
- Rising/Falling Candle Volume, Performance: Average performance based on whether volume is rising or falling from the start to end of the candle pattern.
-
Reversal Rates
- Closing Price Confirmation Reversal Rate: Percentage of times a higher/lower close the timeframe interval after the candle pattern confirms a reversal.
- Candle Color Confirmation Reversal Rate: Percentage of times a black/white candle the timeframe interval after the pattern confirms a reversal.
- Opening Gap Confirmation Reversal Rate: Percentage of times a price gap higher/lower the day after the pattern confirms a reversal.
- Reversal/Continuation Rate: Percentage of candle patterns with price trending up/down and breaking out up/down, showing the likely breakout direction based on the trend leading to the pattern.
- Percentage of Reversals/Continuations for Each 12-Month Low, Middle, or High: Distribution of breakout prices over the yearly price range, indicating behavior near yearly lows, middles, or highs.
- Black/White Body Reversal Rate: For single-line candles, showing how often the candle acted as a reversal, sorted by body color.
- Closing Price Confirmation Reversal Rate: Percentage of times a higher/lower close the timeframe interval after the candle pattern confirms a reversal.
-
Performance Indicators
- Closing Price Confirmation, Performance: Performance from the closing price the timeframe interval after the candle pattern confirms as valid.
- Candle Color Confirmation, Performance: Performance based on the color of the confirming candle the timeframe interval after the pattern ends.
- Opening Gap Confirmation, Performance: Performance based on the opening gap direction the timeframe interval after the pattern ends.
- Closing Price Confirmation, Performance: Performance from the closing price the timeframe interval after the candle pattern confirms as valid.
These explanations should help users understand the various metrics and statistics provided in the Pattern Statistical Analysis section of the Scanner module. For more detailed definitions, refer to Bulkowski's "Encyclopedia of Candlestick Charts" .