The "Patterns" section in the Scanner module provides a comprehensive overview of detected patterns during the backtest. This section is crucial for traders to analyze and validate the patterns identified by the scanner, enabling them to make informed trading decisions based on historical data.
Overview
This section is divided into two main parts:
- Patterns Table: A detailed list of all detected patterns with various attributes.
- Chart Visualization: A visual representation of the patterns on the chart.
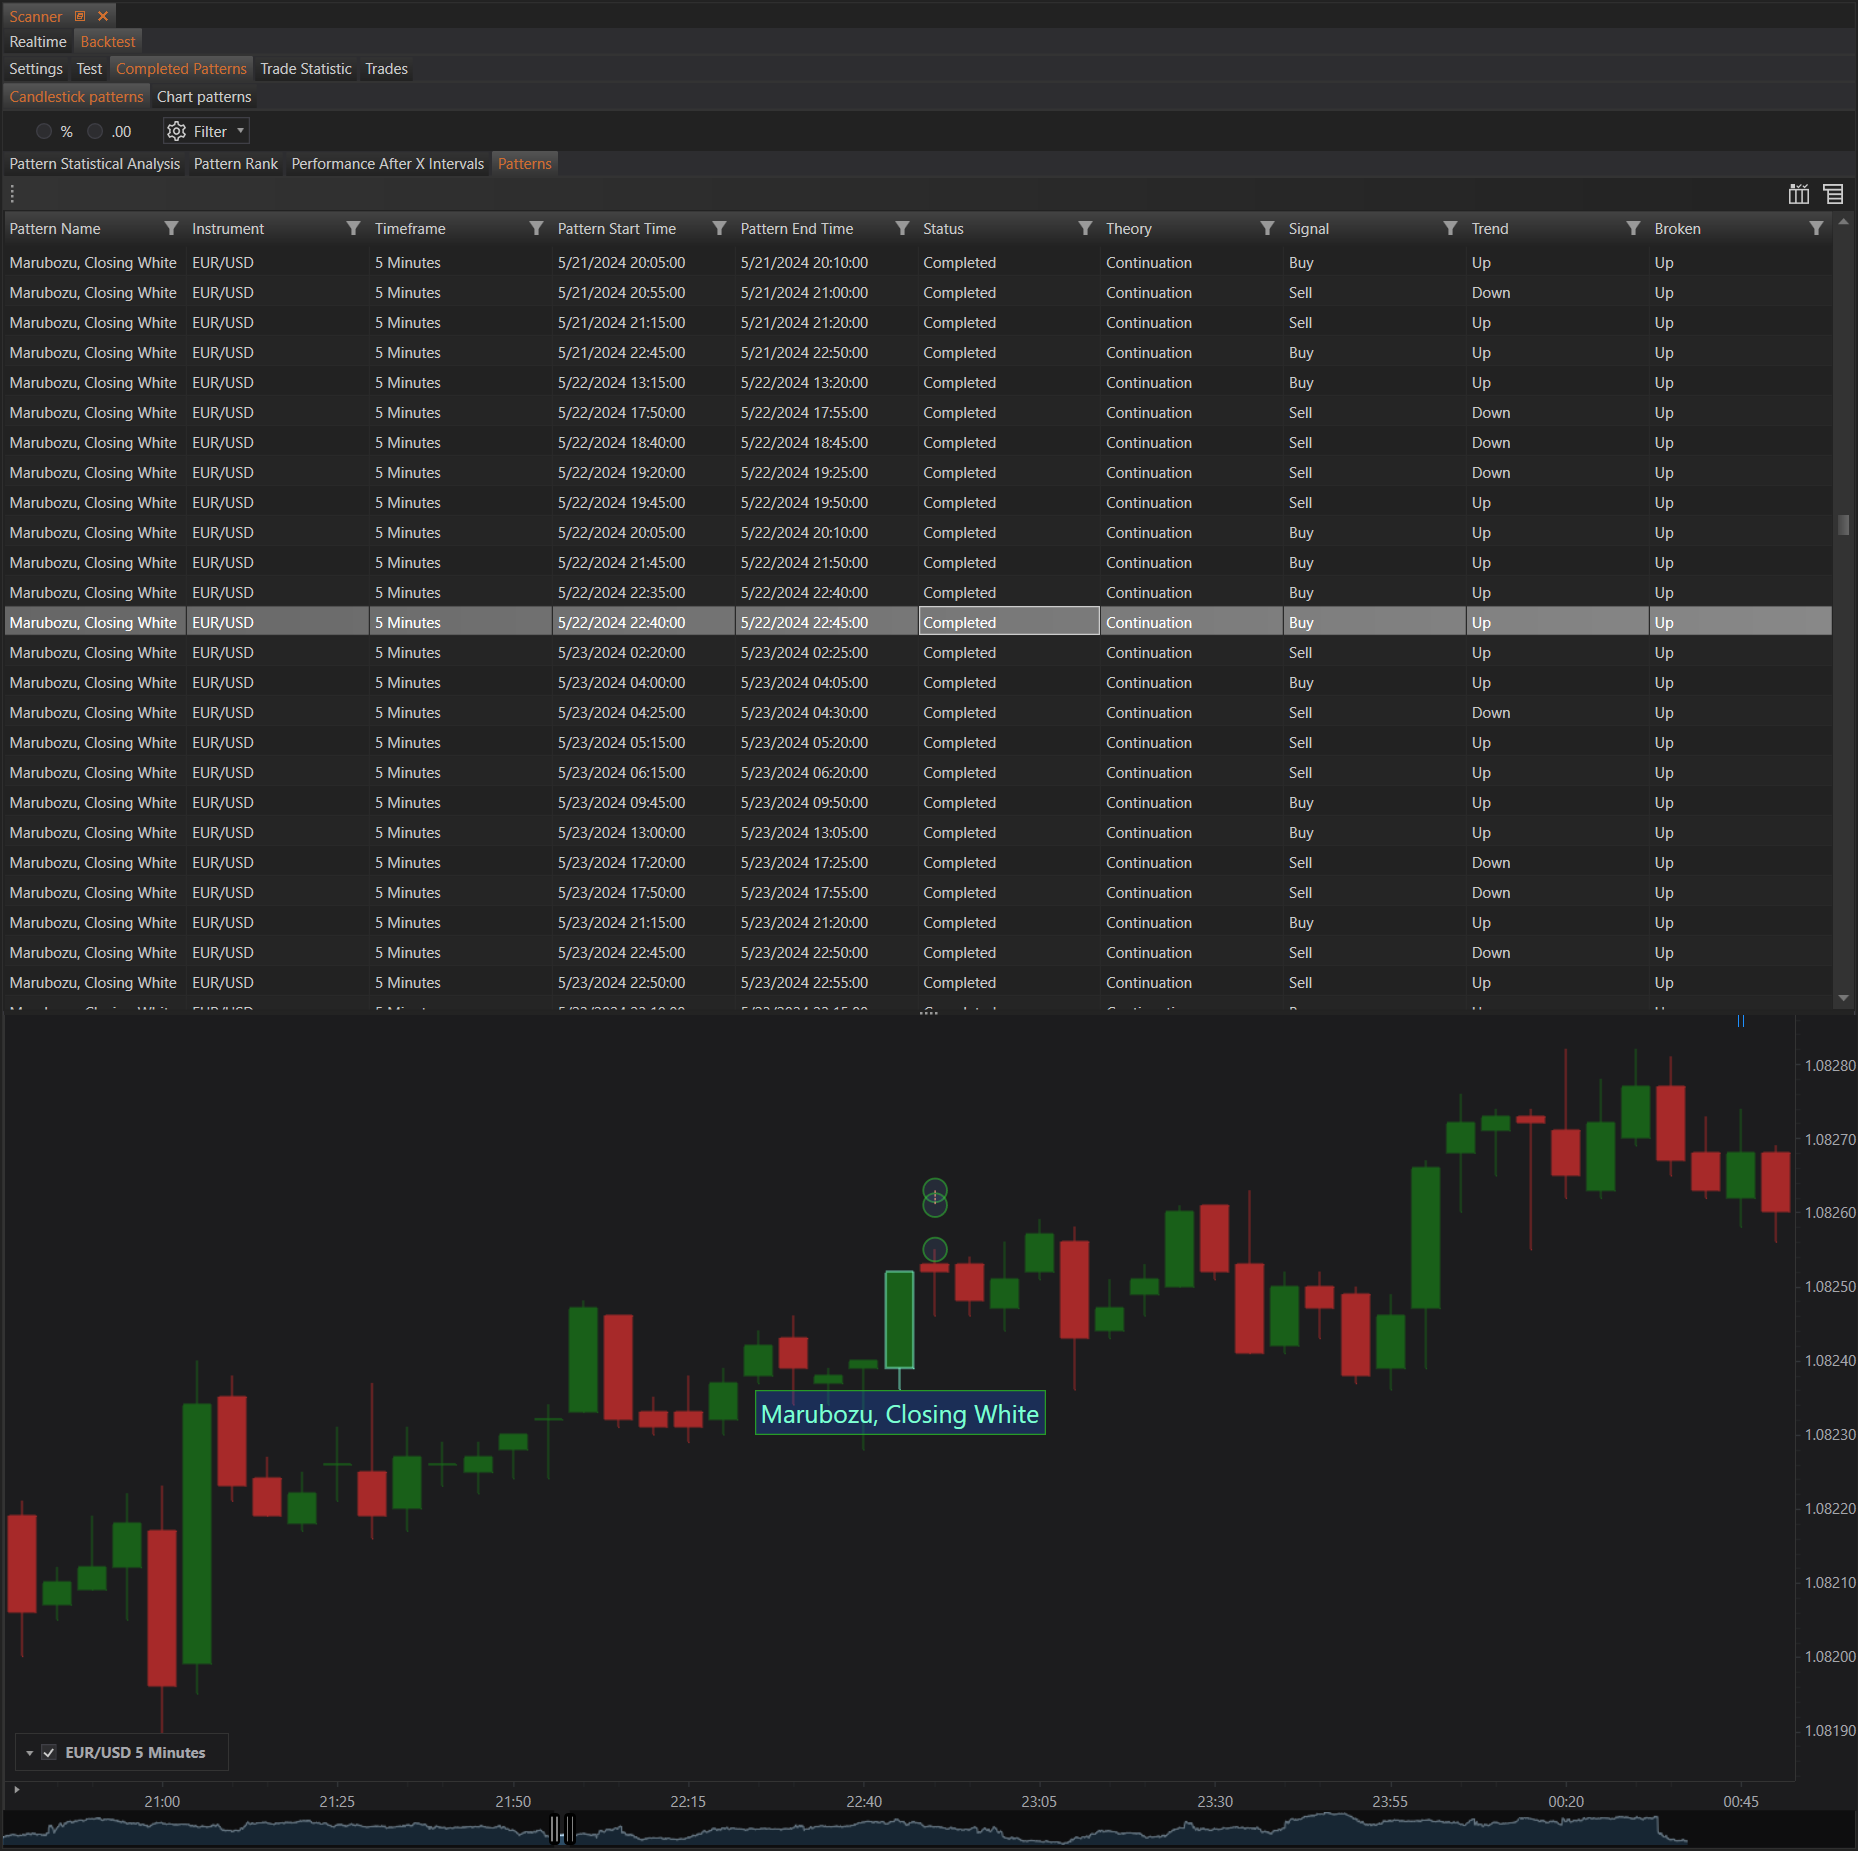
Patterns Table
The Patterns Table lists all the detected patterns and provides essential details for each pattern. The columns in the table include:
- Pattern Name: The name of the detected pattern, such as "Marubozu, Closing White."
- Instrument: The financial instrument in which the pattern was detected, e.g., EUR/USD.
- Timeframe: The timeframe used for detecting the pattern, such as 5 minutes.
- Pattern Start Time: The time when the pattern started.
- Pattern End Time: The time when the pattern ended.
- Status: Indicates whether the pattern detection is completed.
- Theory: The theoretical behavior of the pattern, which could be "Continuation" or "Reversal."
- Signal: The trading signal generated by the pattern, either "Buy" or "Sell."
- Trend: The prevailing market trend during the pattern detection, either "Up" or "Down."
- Broken: Indicates whether the pattern was broken, which means whether the expected outcome was achieved or not.
Chart Visualization
The lower part of the section displays the selected pattern on the chart. This visualization allows traders to see how the pattern formed within the price data and aids in further analysis. Key features include:
- Highlighted Pattern: The detected pattern is highlighted on the chart for easy identification.
- Price Data: The price data corresponding to the pattern is displayed, allowing traders to observe the context in which the pattern occurred.
Example Interpretation
For instance, the table might show multiple occurrences of the "Marubozu, Closing White" pattern in the EUR/USD instrument with a 5-minute timeframe. Each row provides the start and end time of the pattern, its status, theoretical behavior, generated signal, market trend during detection, and whether the pattern was broken.
The chart visualization below the table highlights one of these patterns, allowing traders to see the specific price movements that constituted the "Marubozu, Closing White" pattern. This helps in understanding how the pattern performed in the historical data and whether it adhered to its theoretical expectations.
Benefits
- Detailed Analysis: Provides a comprehensive list of patterns with essential details for in-depth analysis.
- Visual Confirmation: Allows traders to visually confirm the patterns on the chart, enhancing their confidence in the detected patterns.
- Historical Validation: Enables traders to validate the effectiveness of patterns based on historical data, aiding in refining their trading strategies.
This section, therefore, is integral to the Scanner module, offering traders valuable insights into pattern detection and performance, which are critical for making informed trading decisions.