The Performance After X Intervals section in the Scanner module provides detailed insights into how candlestick patterns perform over different time intervals. This analysis helps traders understand the potential outcomes of patterns based on historical performance data over specified periods. Below is an explanation of the columns and terms used in this section:
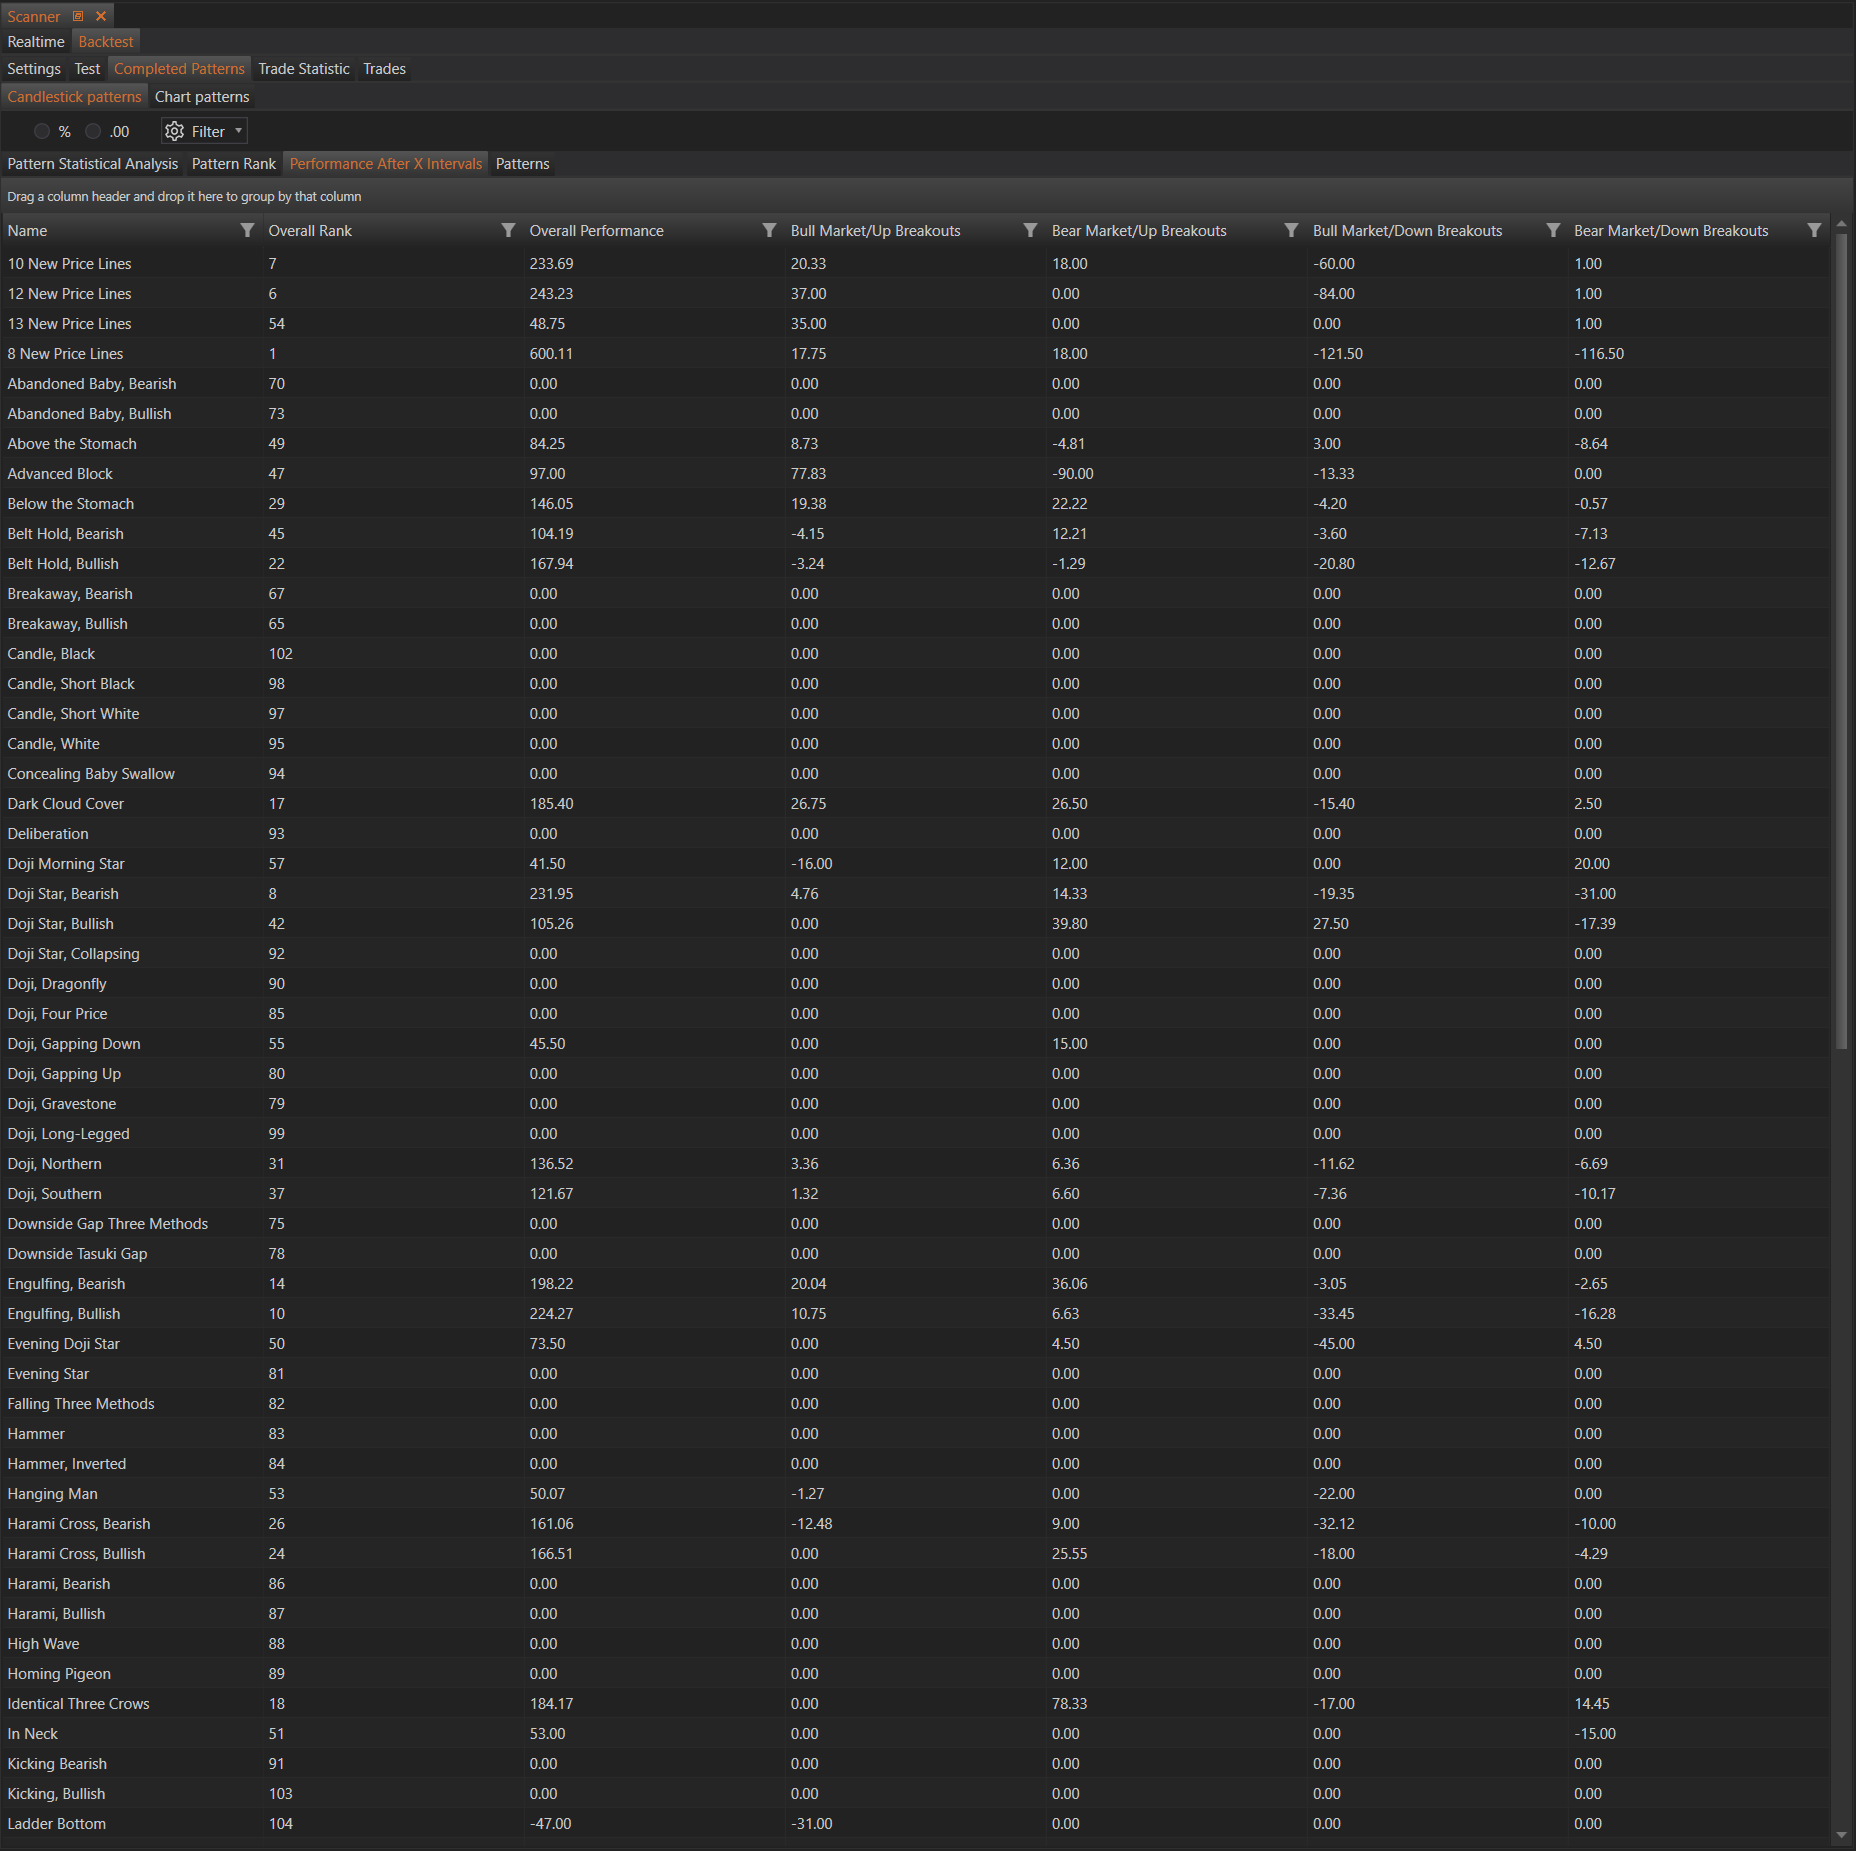
The "Performance After X Intervals" section in the Scanner module provides a comprehensive analysis of the performance of various candlestick patterns over different intervals. This section helps traders evaluate the effectiveness of patterns in different market conditions and timeframes, allowing for more informed trading decisions. Below is a detailed explanation of the columns and terms used in this section:
Columns and Terms
-
Name
- This column lists the names of the candlestick patterns being analyzed, such as "8 New Price Lines," "Shooting Star, Two-Candle," etc.
-
Overall Rank
- The overall rank of the candlestick pattern based on its performance across all market conditions and intervals.
-
Overall Performance
- The cumulative performance of the pattern, considering all market conditions and intervals. This metric helps to understand the pattern's general effectiveness.
-
Bull Market (Up Breakouts)
- Performance: The performance of the pattern during up breakouts in a bull market. Positive values indicate profitable outcomes, while negative values indicate losses.
- Breakouts: The number of times the pattern resulted in an up breakout in a bull market.
-
Bear Market (Up Breakouts)
- Performance: The performance of the pattern during up breakouts in a bear market.
- Breakouts: The number of times the pattern resulted in an up breakout in a bear market.
-
Bull Market (Down Breakouts)
- Performance: The performance of the pattern during down breakouts in a bull market.
- Breakouts: The number of times the pattern resulted in a down breakout in a bull market.
-
Bear Market (Down Breakouts)
- Performance: The performance of the pattern during down breakouts in a bear market.
- Breakouts: The number of times the pattern resulted in a down breakout in a bear market.
Example Analysis
For each pattern listed, the table provides detailed performance metrics in various market conditions, including bull and bear markets and whether the breakout was up or down. This allows traders to identify patterns that perform well in specific scenarios and time intervals.
Example Interpretation
-
8 New Price Lines:
- Overall Rank: 7
- Overall Performance: 233.49
- Bull Market (Up Breakouts): 20.33 (Performance), 18 (Breakouts)
- Bear Market (Up Breakouts): 18.00 (Performance), 18 (Breakouts)
- Bull Market (Down Breakouts): -60.00 (Performance), 1 (Breakouts)
- Bear Market (Down Breakouts): 1.00 (Performance), 1 (Breakouts)
- Interpretation: This pattern ranks high overall, performing well in both bull and bear market up breakouts, with consistent performance. It is less reliable for down breakouts in a bull market but shows positive performance in a bear market down breakout.
-
Shooting Star, Two-Candle:
- Overall Rank: 1
- Overall Performance: 47.50
- Bull Market (Up Breakouts): 33.00 (Performance), 10 (Breakouts)
- Bear Market (Up Breakouts): 12.00 (Performance), 10 (Breakouts)
- Bull Market (Down Breakouts): -16.00 (Performance), 12 (Breakouts)
- Bear Market (Down Breakouts): 4.00 (Performance), 12 (Breakouts)
- Interpretation: This pattern ranks the highest overall, with strong performance in bull market up breakouts and moderate performance in bear market up breakouts. It performs negatively in bull market down breakouts but shows moderate gains in bear market down breakouts.
This section helps traders to identify the most effective patterns for their strategies based on historical performance data in different market conditions and timeframes. For a detailed explanation of each pattern and its performance metrics, users can refer to Bulkowski's "Encyclopedia of Candlestick Charts."