The "Pattern Statistical Analysis" page provides an in-depth analysis of various chart patterns identified during the backtesting phase. The statistics and insights are derived from the methodologies and definitions provided in Thomas N. Bulkowski's "Encyclopedia of Chart Patterns." This section includes several key areas:
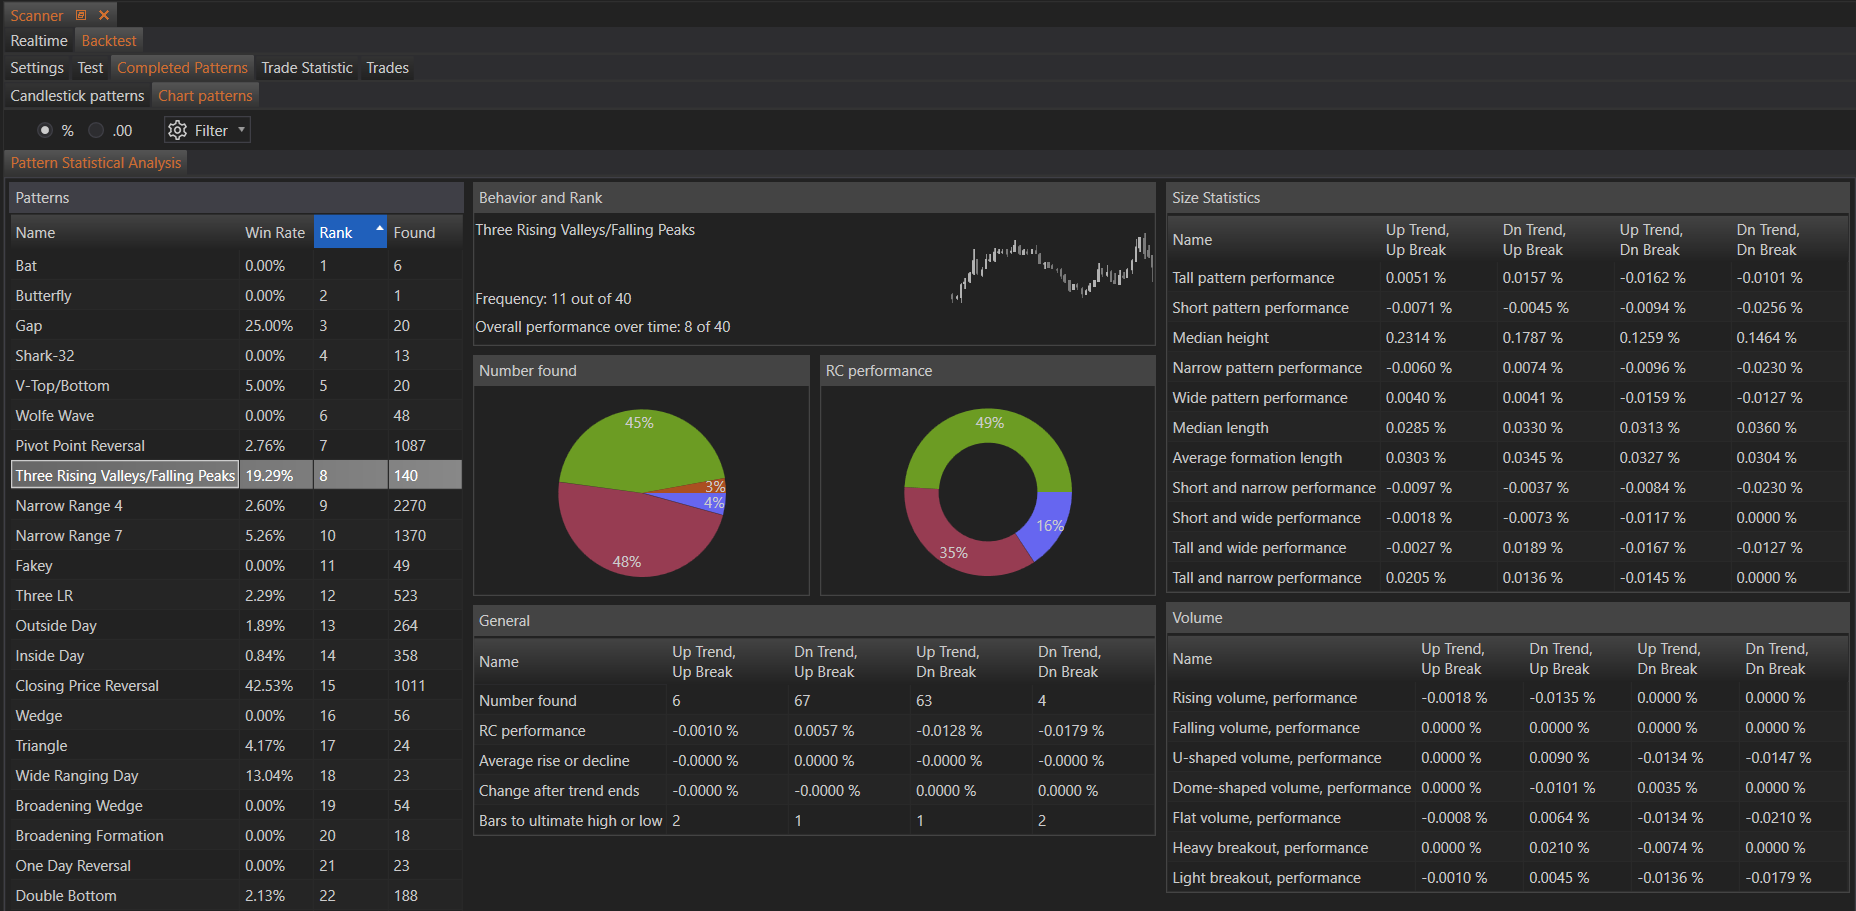
Patterns Table
- Name: The name of the chart pattern identified.
- Win Rate: The percentage of times the pattern led to a successful trade.
- Rank: The ranking of the pattern based on its performance.
- Found: The number of times this pattern was identified in the dataset.
Behavior and Rank
This section provides detailed insights into the behavior and performance of the selected pattern:
- Pattern Name: Name of the pattern being analyzed.
- Frequency: The occurrence rate of the pattern.
- Overall Performance: Cumulative performance of the pattern over time.
Size Statistics
Analyzes the size and its impact on the performance of the pattern:
- Tall Pattern Performance: Performance when the pattern is tall.
- Short Pattern Performance: Performance when the pattern is short.
- Median Height: Median height of the pattern.
- Narrow Pattern Performance: Performance when the pattern is narrow.
- Wide Pattern Performance: Performance when the pattern is wide.
- Median Length: Median length of the pattern.
- Average Formation Length: Average length of the pattern formation.
- Short and Narrow Performance: Performance when the pattern is both short and narrow.
- Short and Wide Performance: Performance when the pattern is short and wide.
- Tall and Wide Performance: Performance when the pattern is tall and wide.
- Tall and Narrow Performance: Performance when the pattern is tall and narrow.
Volume Statistics
Examines the volume characteristics associated with the pattern:
- Rising Volume Performance: Performance when volume is increasing.
- Falling Volume Performance: Performance when volume is decreasing.
- Heavy Breakout Performance: Performance when breakout volume is heavy.
- Light Breakout Performance: Performance when breakout volume is light.
- U-Shaped Volume Performance: Performance when volume forms a U-shape.
- Dome-Shaped Volume Performance: Performance when volume forms a dome shape.
- Flat Volume Performance: Performance when volume is flat.
General Statistics
- Number Found: Total instances of the pattern found.
- RC Performance: Rate of Change performance.
- Average Rise or Decline: Average percentage change in price.
- Change After Trend Ends: Percentage change after the trend ends.
- Bars to Ultimate High or Low: Number of bars to the highest or lowest point after the pattern completes.
Performance Indicators
- Closing Price Confirmation: Reversal rate based on the closing price.
- Candle Color Confirmation: Performance based on the candle color at the breakout.
- Breakout Above/Below MA: Performance when the breakout is above or below a moving average.
Summary
The "Pattern Statistical Analysis" page provides detailed statistical insights into the performance and characteristics of various chart patterns. By examining factors such as size, volume, and frequency, traders can better understand the likelihood of a pattern’s success and make more informed trading decisions. The analysis leverages the extensive research and methodologies from Thomas N. Bulkowski’s "Encyclopedia of Chart Patterns," ensuring robust and reliable data-driven insights.