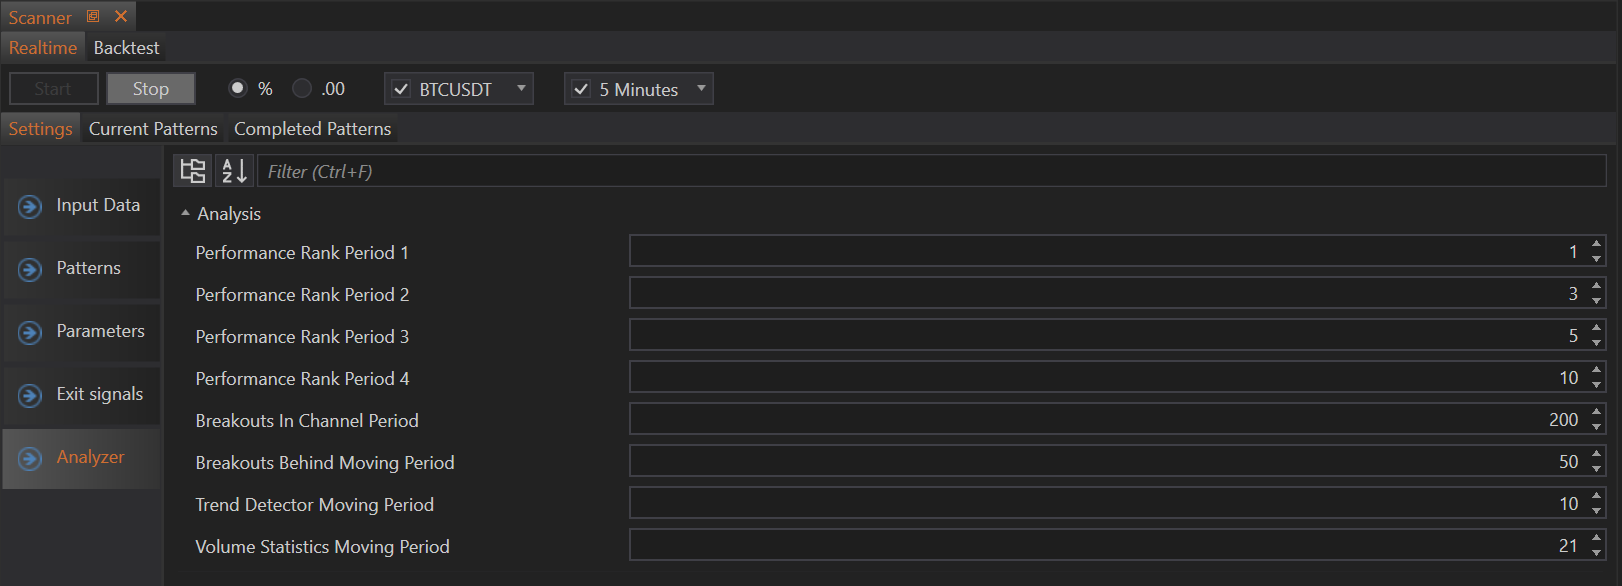
The Analyzer section in the Scanner module settings provides parameters for detailed performance analysis of detected patterns. This section allows you to fine-tune the statistical analysis to gauge the effectiveness and reliability of various trading patterns.
Analysis Parameters
-
Performance Rank Period 1, 2, 3, 4: These periods (1, 3, 5, and 10 days by default) measure the performance rank of the candle patterns. The system sums the percentage price changes over these periods and ranks the patterns. The higher the performance, the better the rank. Downward breakout performance is adjusted by multiplying it by -1.
-
Breakout in Channel Period: Defines the period over which the high and low bounds of a channel are detected. This helps to determine the position of the current price within the channel: near high, near low, or in the middle.
-
Breakouts Behind Moving Period: Specifies the period for the moving average used to detect breakouts. This statistic shows whether the breakout occurs above or below the defined moving average.
-
Trend Detector Moving Period: Sets the period for the moving average used to detect the current trend. If the current price is above this moving average, it indicates an uptrend; otherwise, it indicates a downtrend.
-
Volume Statistics Moving Period: Defines the period for the moving average used to detect average volume. This helps to compute volume statistics like above-average volume or heavy volume during breakouts.
These parameters allow users to customize their analysis, providing a robust statistical foundation for evaluating trading patterns and making informed trading decisions.