The Trades module in FinStudio provides a detailed view of all executed trades, offering traders an in-depth analysis of their trading performance. This module is crucial for monitoring, reviewing, and analyzing individual trades to improve trading strategies.
Trades Tab
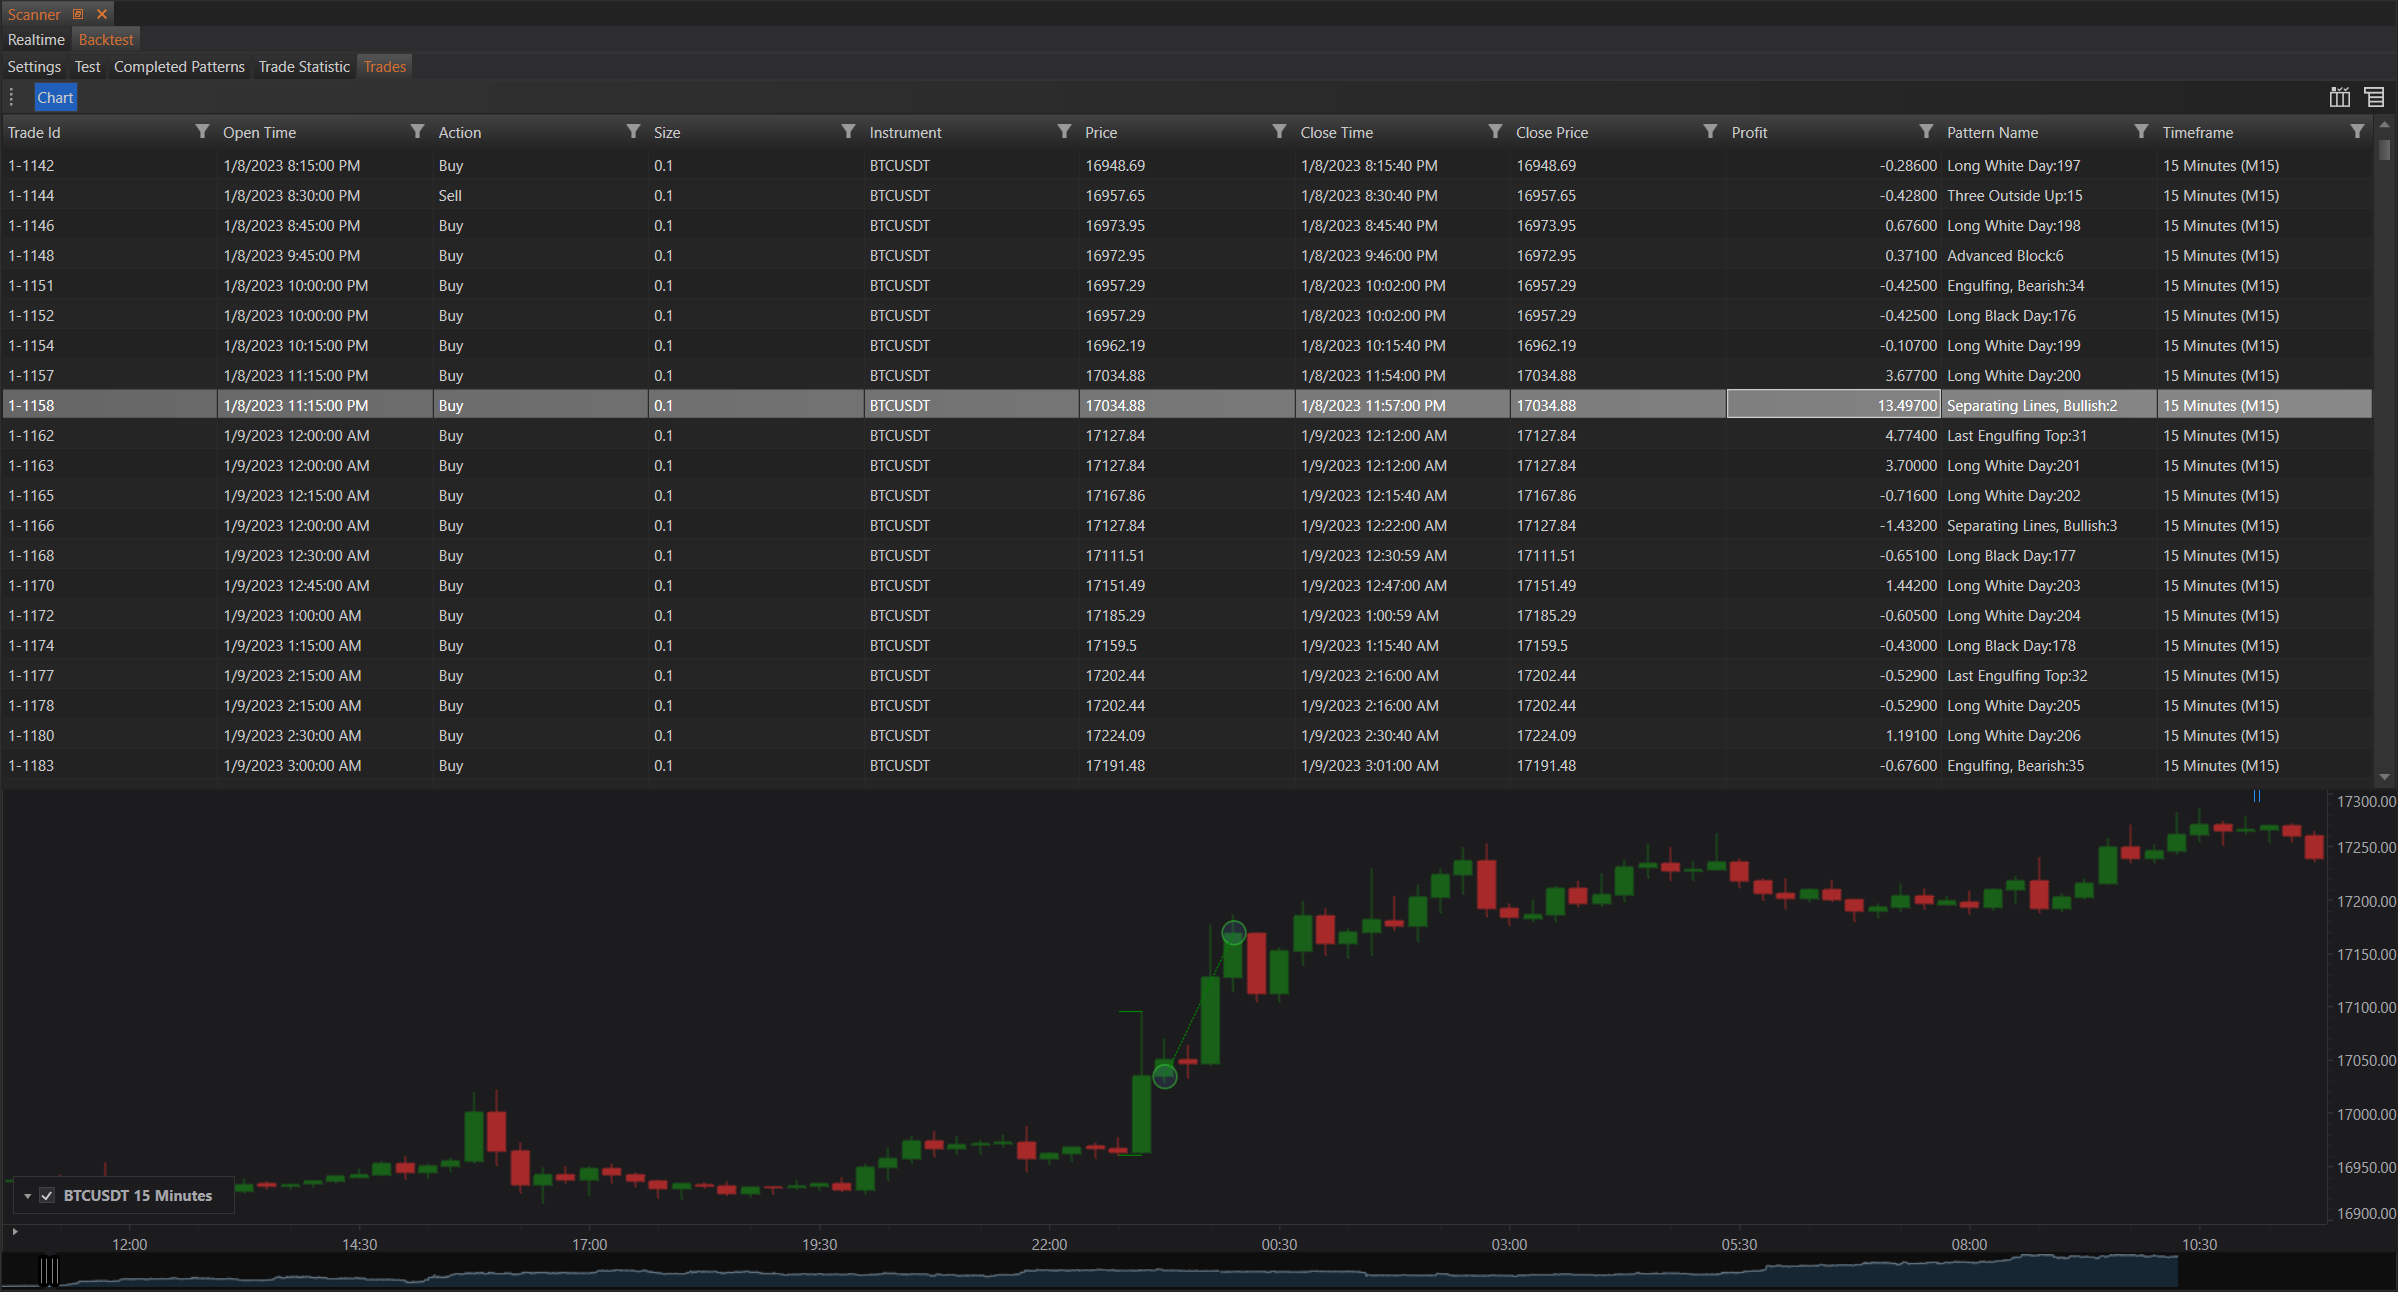
The Trades tab displays a comprehensive table of all trades executed during the backtest. This includes crucial information such as trade ID, open and close times, action (buy/sell), instrument, price, profit, and the pattern name that triggered the trade. Additionally, it includes a chart at the bottom to visually track the trades on the selected instrument's price movements.
Detailed Sections
Trade List
The trade list provides detailed information for each trade, including:
- Trade ID: Unique identifier for each trade.
- Open Time: Timestamp when the trade was opened.
- Action: Indicates whether the trade was a buy or sell.
- Instrument: The financial instrument traded.
- Price: The price at which the trade was executed.
- Close Time: Timestamp when the trade was closed.
- Close Price: The price at which the trade was closed.
- Profit: The profit or loss realized from the trade.
- Pattern Name: The name of the trading pattern or strategy that triggered the trade.
- Timeframe: The timeframe used for the trade.
Chart Integration
The bottom section of the module includes a chart that displays the price movements of the selected instrument. Trades are plotted on this chart, providing a visual representation of where and when trades were executed. This helps in understanding the context of each trade in relation to market movements.
Trade Details
- Click to Highlight: Clicking on a trade in the list highlights it, providing more details and marking it on the chart.
- Visual Analysis: Traders can see the exact points of entry and exit on the chart, helping to analyze the effectiveness of each trade visually.
Example
The example provided shows a series of trades executed on BTCUSDT. Each trade is detailed with its open and close times, action, and resulting profit or loss. The chart at the bottom visually represents these trades, giving traders an easy way to correlate the trades with market movements.
Conclusion
The Trades module in FinStudio is a powerful tool for traders to monitor and analyze their trading activities. By providing detailed trade information and integrating it with visual chart analysis, traders can gain valuable insights into their trading performance and make informed decisions to refine their strategies.