The Advanced Benchmarks section within the Result Analysis module of FinStudio provides a comprehensive suite of metrics for evaluating trading strategies. This section is split into four parts: Regression Statistics, Risk Statistics, Extreme Risk Analysis, and Drawdown Analysis. Each part offers detailed insights into various aspects of strategy performance relative to benchmarks.
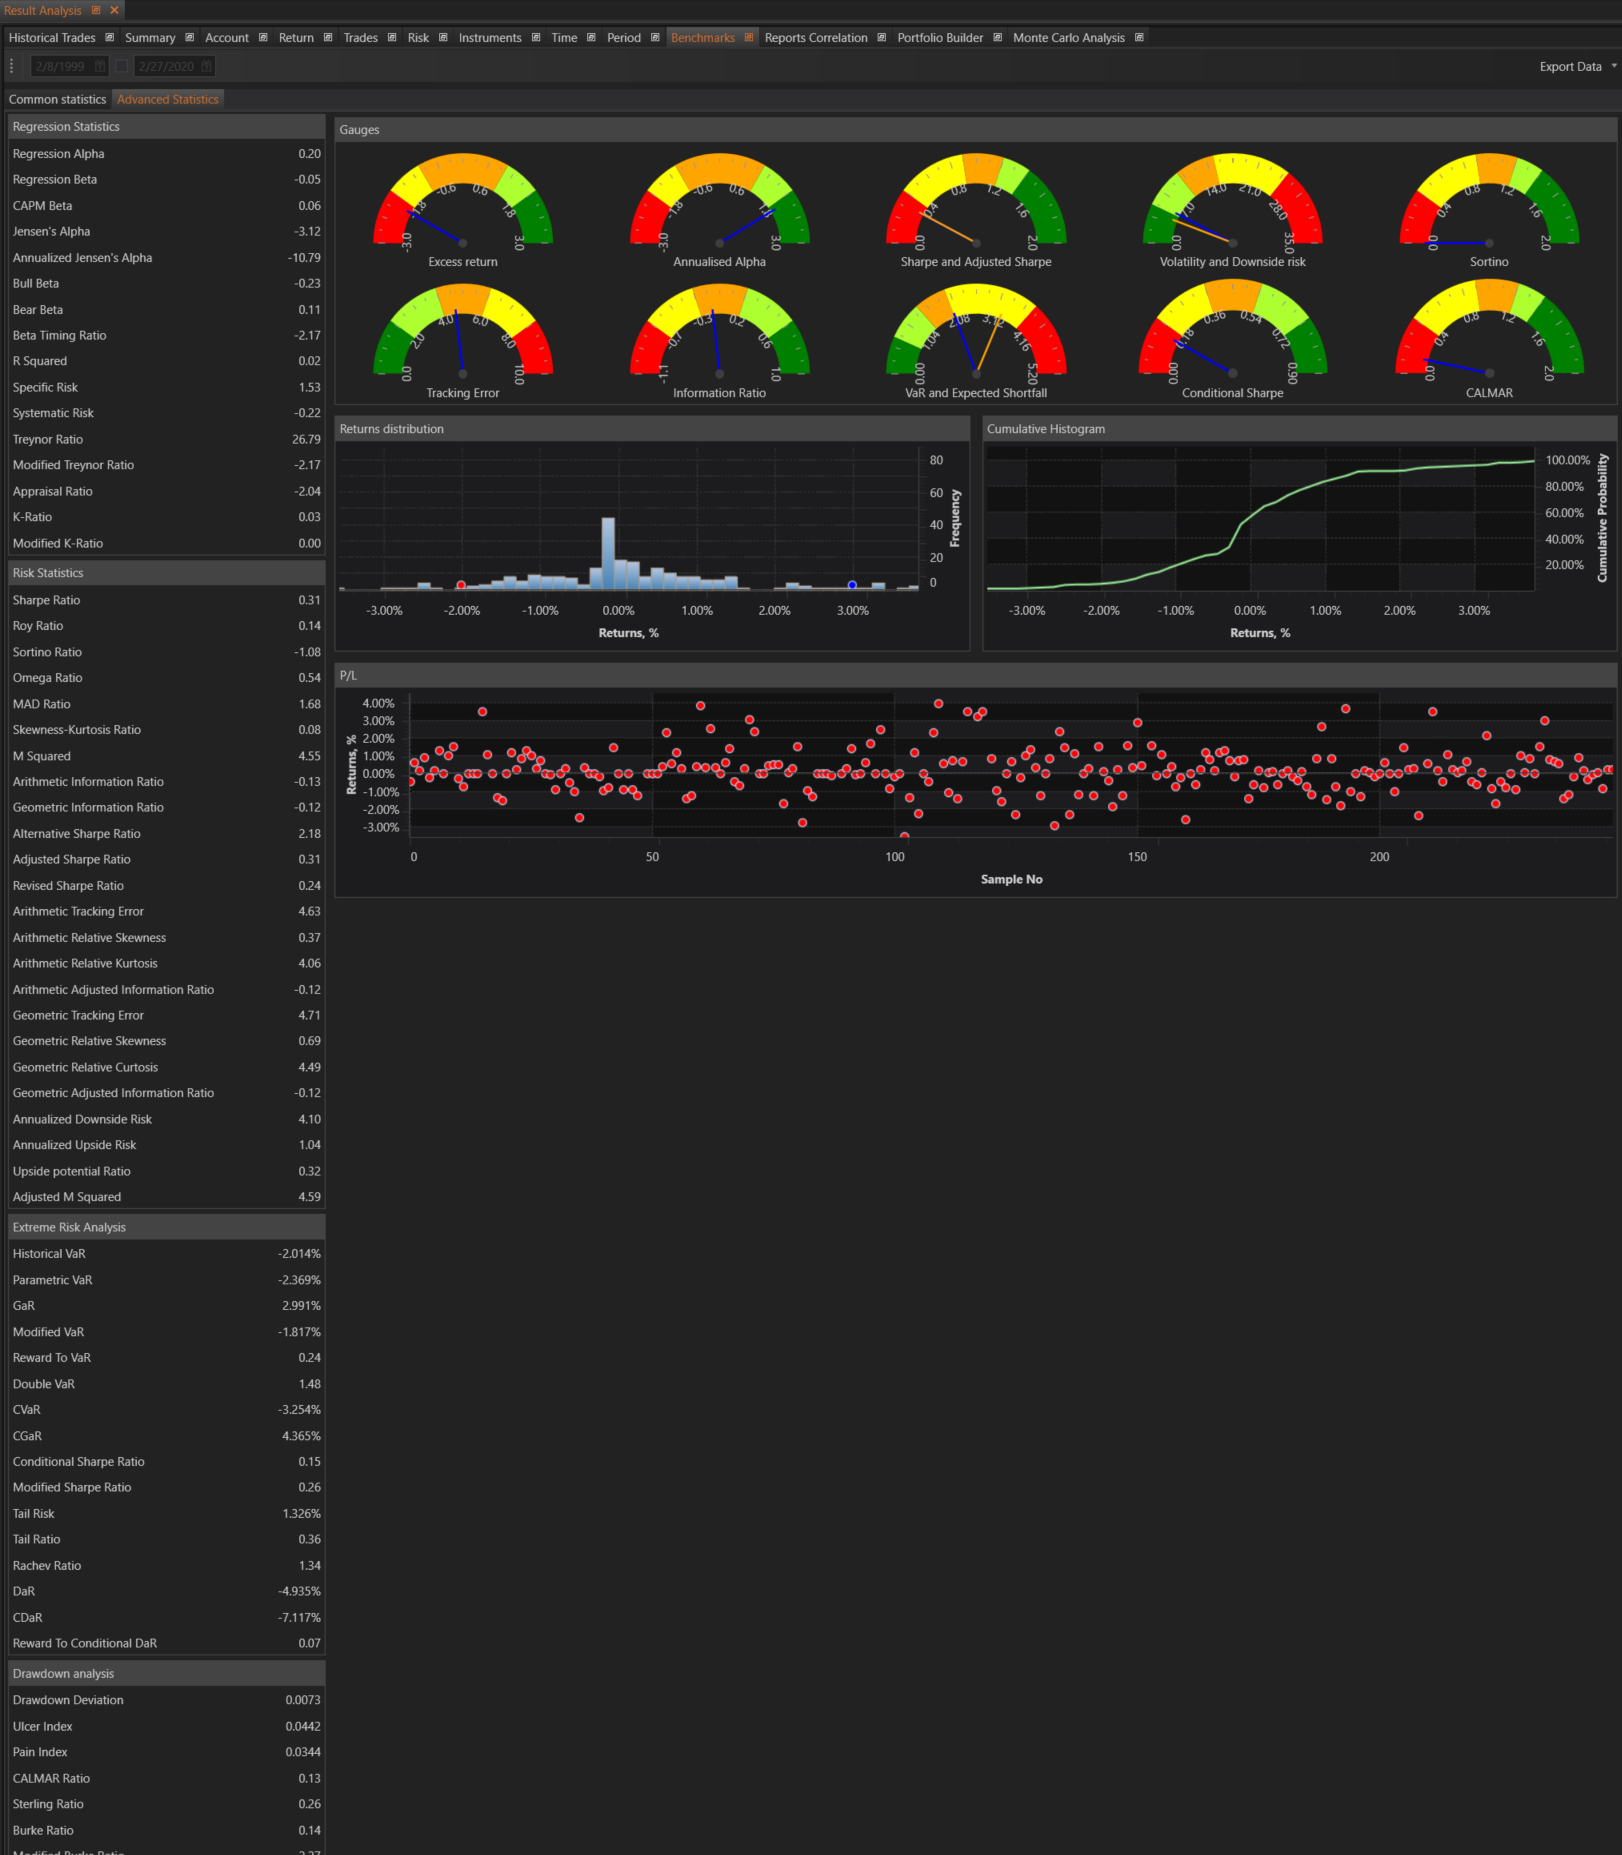
Regression Statistics
Regression statistics provide insights into the relationship between portfolio returns and benchmark returns. These metrics help traders understand how their portfolio is performing relative to the benchmark and assess the portfolio's risk-adjusted performance. Key metrics include:
- Regression Alpha: Represents the excess return of the portfolio over the expected return predicted by the regression model.
- Regression Beta: Indicates the portfolio's sensitivity to the benchmark.
- CAPM Beta: Reflects the systematic risk of the portfolio relative to the benchmark.
- Jensen's Alpha: Represents the excess return adjusted for systematic risk.
- Bull Beta and Bear Beta: Measure the portfolio's sensitivity during positive and negative market periods, respectively.
- Beta Timing Ratio: Assesses the portfolio's performance in different market conditions.
- R Squared (R²): Indicates the degree of diversification.
- Treynor Ratio: Uses systematic risk in the denominator instead of total risk.
- Appraisal Ratio: Uses Jensen’s alpha in the numerator and specific risk in the denominator.
- K-Ratio and Modified K-Ratio: Measure the reward-to-risk based on the slope of cumulative portfolio returns through time.
Risk Statistics
Risk statistics provide a comprehensive analysis of various risk measures and ratios. These metrics help traders understand the risk-adjusted performance of their strategies and compare them to benchmarks. Key metrics include:
- Sharpe Ratio: Compares the return of an investment to its risk.
- Roy Ratio: Similar to the Sharpe Ratio, but uses the annualized minimum target return.
- Downside Risk: Measures the variability of underperformance below a minimum target rate.
- Upside Risk: Measures the variability of returns that exceed a given target.
- Sortino Ratio: Uses downside risk instead of total risk.
- Omega Ratio: Captures the information in the higher moments of a return distribution.
- MAD Ratio: Uses mean absolute deviation instead of standard deviation.
- Skewness-Kurtosis Ratio: Measures the distortion and combined weight of a distribution's tails.
- M Squared: Compares portfolios with different levels of risk.
- Information Ratios: Evaluate the performance of a portfolio relative to a benchmark.
- Adjusted Sharpe Ratio: Incorporates penalties for negative skewness and excess kurtosis.
- Tracking Errors: Measure the divergence between the portfolio and benchmark price behaviors.
- Upside Potential Ratio: Measures the average sum of returns above a target.
- Adjusted M Squared: Uses the Adjusted Sharpe Ratio.
Extreme Risk Analysis
Extreme risk analysis focuses on the potential extreme risks associated with a portfolio. These metrics help traders understand worst-case scenarios and their potential impacts. Key metrics include:
- Value at Risk (VaR): Measures the worst expected loss over a given time interval.
- Historical VaR: Uses historical returns to calculate VaR.
- Parametric VaR: Assumes returns are normally distributed.
- Gain at Risk (GaR): Measures the best expected win over a given time interval.
- Modified VaR: Adjusts VaR for kurtosis and skewness.
- Conditional VaR (CVaR): Measures the average return conditional on exceeding VaR.
- Reward to VaR: Uses VaR in the denominator instead of standard deviation.
- Double VaR: Gain-to-loss ratio with potential upside in the numerator.
- Tail Risk: Measures the variance of returns in the tail of the distribution.
- Tail Ratio: Uses tail risk in the denominator.
- Rachev Ratio: Gain-loss ratio with tail gain and conditional VaR.
- Drawdown at Risk (DaR): Ranks continuous negative returns.
- Conditional Drawdown at Risk (CDaR): Averages drawdowns exceeding DaR.
- Reward to Conditional DaR: Uses CDaR in the denominator.
Drawdown Analysis
Drawdown analysis provides insights into the severity and frequency of losses in a portfolio. These metrics help traders understand and manage the risks associated with drawdowns. Key metrics include:
- Drawdown Deviation: Standard deviation type statistic using individual drawdowns.
- Ulcer Index: Combines the impact of time underwater and the depth of drawdown.
- Pain Index: Measures the average depth of drawdowns.
- CALMAR Ratio: Uses maximum drawdown instead of standard deviation.
- Sterling Ratio: Uses the average drawdown over the analysis period.
- Burke Ratio: Penalizes major drawdowns.
- Martin Ratio: Uses the Ulcer Index in the denominator.
- Pain Ratio: Uses the Pain Index in the denominator.
These advanced benchmarks provide traders with a comprehensive view of their strategy's performance relative to benchmarks, helping them make data-driven decisions to refine and optimize their trading strategies.