The Common Benchmarks section within the Result Analysis module of FinStudio provides a comprehensive statistical analysis of the strategy's monthly and daily returns compared to a benchmark. This section helps traders evaluate the performance of their strategy relative to a benchmark, offering detailed insights into various performance metrics.
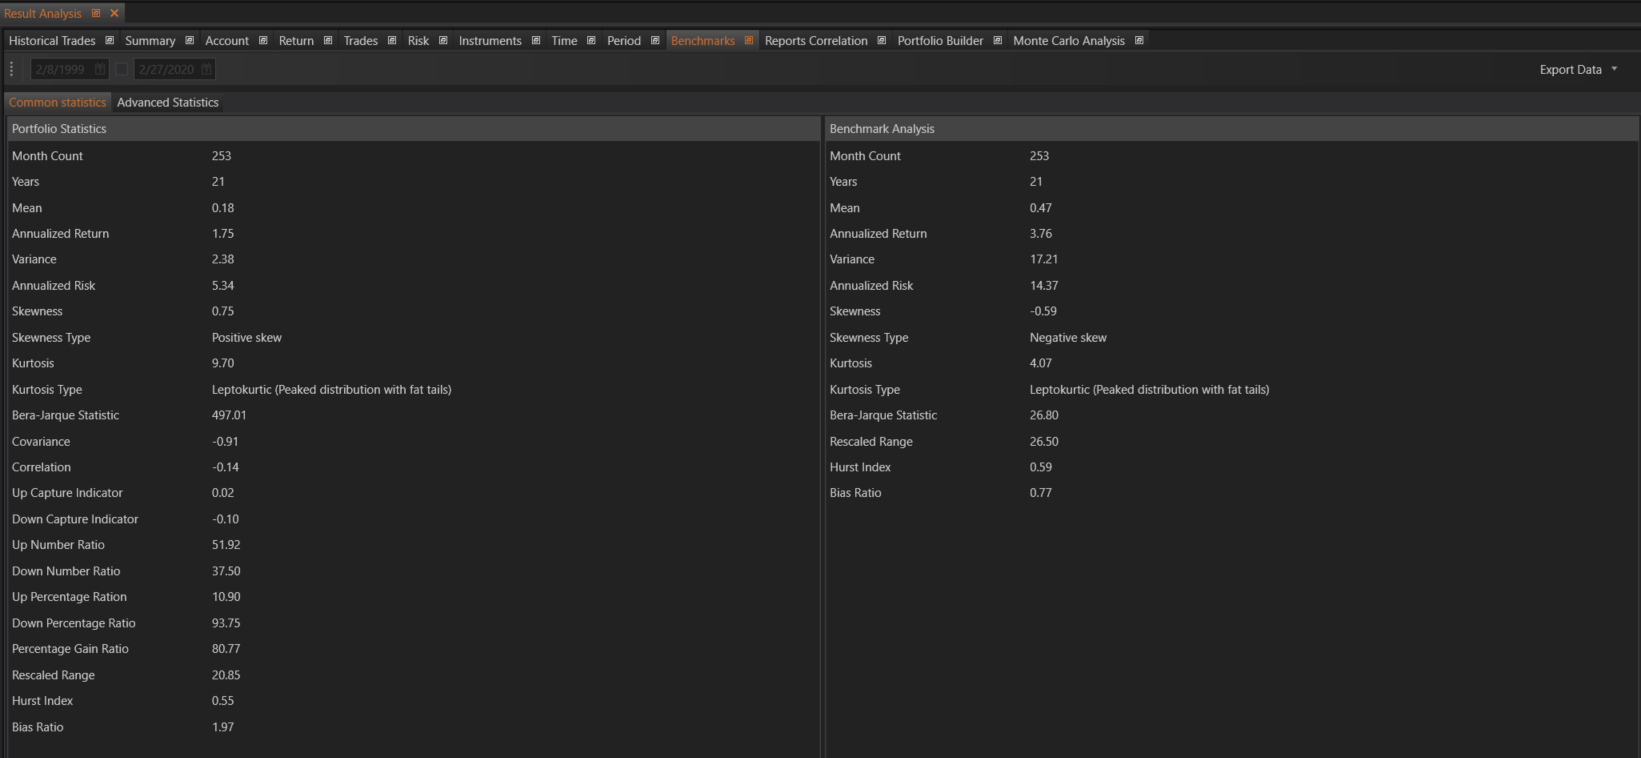
Portfolio Statistics
This section provides a statistical analysis of the strategy's monthly and daily returns.
- Month Count: Number of months included in the analysis.
- Years: Number of years included in the analysis.
- Mean: The average return value.
\[
\text{Mean} \; \bar{r} = \frac{\sum r_{i}}{N}
\]
Annualized Return
The geometric average amount of money earned by the strategy each year over a given time period.
\[
\text{Annualized Return} = \left( \left( \frac{\text{Final Balance}}{\text{Initial Balance}} \right)^{\frac{t}{N}} - 1 \right) \times 100\%
\]
where \( t = 12 \) for monthly calculation and \( t = 252 \) for daily.
Variance
The average squared deviation of returns from the mean.
\[
\text{Variance} = \frac{\sum (r_{i} - \bar{r})^2}{N}
\]
Standard Deviation
The square root of the variance.
\[
\sigma = \sqrt{\text{Variance}}
\]
Annualized Risk
The annualized standard deviation of returns.
\[
\text{Annualized Risk} = \sigma \times \sqrt{t}
\]
where \( t = 12 \) for monthly calculation and \( t = 252 \) for daily.
Skewness
A measure of the distortion or asymmetry that deviates from the symmetrical bell curve, or normal distribution, in a set of data.
\[
\text{Skewness} \; \zeta = \sum_{i=1}^{N} \left( \frac{r_{i} - \bar{r}}{\sigma} \right)^3 \times \frac{1}{N}
\]
Skewness Type
- If Skewness > 0, the skewness is positive
- if Skewness < 0, the skewness is negative
- if Skewness = 0, the returns distribution is normal.
Kurtosis
A measure of the combined weight of a distribution's tails relative to the center of the distribution.
\[
\text{Kurtosis} \; K = \sum_{i=1}^{N} \left( \frac{r_{i} - \bar{r}}{\sigma} \right)^4 \times \frac{1}{N}
\]
Kurtosis Type
- The kurtosis of a normal distribution is 3 (mesokurtic).
- Greater than 3 may indicate a peaked distribution with fat tails (leptokurtic),
- Less than 3 may indicate a less peaked distribution with thin tails (platykurtic).
Bera-Jarque Statistic (BJ)
A goodness-of-fit test to determine if sample data have the skewness and kurtosis matching a normal distribution.
\[
\text{BJ} = \frac{N}{6} \times \left( \zeta^2 + \frac{(K - 3)^2}{4} \right)
\]
Covariance
Measures the directional relationship between the returns of the portfolio and the benchmark.
\[
\text{Covariance} = \frac{\sum_{i=1}^{N} (r_{i} - \bar{r}) (b_{i} - \bar{b})}{N}
\]
where \( b_{i} \) is the benchmark return in period \( i \), and \( \bar{b} \) is the mean benchmark return.
Correlation
A descriptive statistic that measures the tendency of portfolio and benchmark returns to move together.
\[
\text{Correlation} \; \rho_{r,b} = \frac{\text{Covariance}}{\sigma \times \sigma_{b}}
\]
where \( \sigma_{b} \) is the standard deviation of benchmark return.
Up Capture Indicator
Measures the extent to which the portfolio captures benchmark returns in positive markets.
\[
\text{Up Capture Indicator} = \frac{\bar{r}^{+}}{\bar{b}^{+}}
\]
where \( \bar{b}^{+} \) is the average positive benchmark return, and \( \bar{r}^{+} \) is the average portfolio return for each period in which the benchmark return is positive.
Down Capture Indicator
Measures the extent to which the portfolio captures benchmark returns in negative markets.
\[
\text{Down Capture Indicator} = \frac{\bar{r}^{-}}{\bar{b}^{-}}
\]
where \( \bar{b}^{-} \) is the average negative benchmark return, and \( \bar{r}^{-} \) is the average portfolio return for each period in which the benchmark return is negative.
Up Number Ratio
Measures the percentage of periods in which the portfolio returns are greater than zero when the benchmark returns are greater than zero.
Down Number Ratio
Measures the percentage of periods in which the excess return is greater than zero when the benchmark return is less than zero.
Up Percentage Ratio
Measures the percentage of periods in which the portfolio's excess return against the benchmark is greater than zero when the benchmark return is greater than zero.
Down Percentage Ratio
Measures the percentage of periods in which the portfolio's excess return is greater than zero when the benchmark return is less than zero.
Percentage Gain Ratio
The ratio of portfolio returns greater than zero compared to the benchmark returns greater than zero.
\[
\text{Percentage Gain Ratio} = \frac{n_{r}^{+}}{n_{b}^{+}}
\]
where \( n_{r}^{+} \) is the number of portfolio returns greater than zero, and \( n_{b}^{+} \) is the number of benchmark returns greater than zero.
Rescaled Range
The range of the maximum cumulative deviation from the mean to the minimum cumulative deviation from the mean divided by the standard deviation of portfolio returns.
\[
\text{Rescaled Range} \; \frac{R}{S} = \frac{\max \left( k^{r} \right) - \min \left( k^{r} \right)}{\sigma}
\]
where
\[
k^{r} = \sum_{i=1}^{k} (r_{i} - \bar{r})
\]
Hurst Index
A statistic for detecting if a portfolio manager’s returns are mean-reverting (anti-persistent), totally random, or persistent.
\[
\text{Hurst index} \; H = \frac{\log \left( \frac{R}{S} \right)}{\log (N)}
\]
Bias Ratio
Defined as the number of returns equal to and closely exceeding zero, divided by the number of returns close to but less than zero.
\[
\text{Bias ratio} \; BR = \frac{\text{Count} \left\langle r_{i} | r_{i} \in [0, \sigma] \right\rangle}{1 + \text{Count} \left\langle r_{i} | r_{i} \in [-\sigma, 0] \right\rangle}
\]
Benchmark Analysis
This section replicates the above analysis for the benchmark, providing a comparative view to evaluate the strategy's performance against a standard benchmark.
Variable Explanations
- \( N \): Number of periods.
- \( r_{i} \): Portfolio return in period \( i \).
- \( \bar{r} \): Mean portfolio return.
- \( t \): Number of periods in a year (12 for monthly, 252 for daily).
- \( \sigma \): Standard deviation of portfolio return.
- \( \zeta \): Skewness of portfolio return.
- \( K \): Kurtosis of portfolio return.
- \( b_{i} \): Benchmark return in period \( i \).
- \( \bar{b} \): Mean benchmark return.
- \( n_{r}^{+} \): Number of portfolio returns greater than zero.
- \( n_{b}^{+} \): Number of benchmark returns greater than zero.
- \( \text{Covariance} \): Covariance between portfolio returns and benchmark returns.
- \( \rho_{r,b} \): Correlation between portfolio and benchmark returns.
- \( R \): Range of cumulative deviations.
- \( S \): Standard deviation of portfolio returns.
- \( k^{r} \): Cumulative deviation from the mean.
The Common Benchmarks section is designed to give traders a comprehensive view of their strategy's performance in relation to a benchmark. By leveraging these detailed insights, traders can make data-driven decisions, refine their strategies, and optimize their trading outcomes.