The Monte Carlo Analysis module provides a comprehensive way to analyze a portfolio or report using Monte Carlo simulation techniques. This analysis helps to understand the potential outcomes and risks by simulating different scenarios based on historical data.
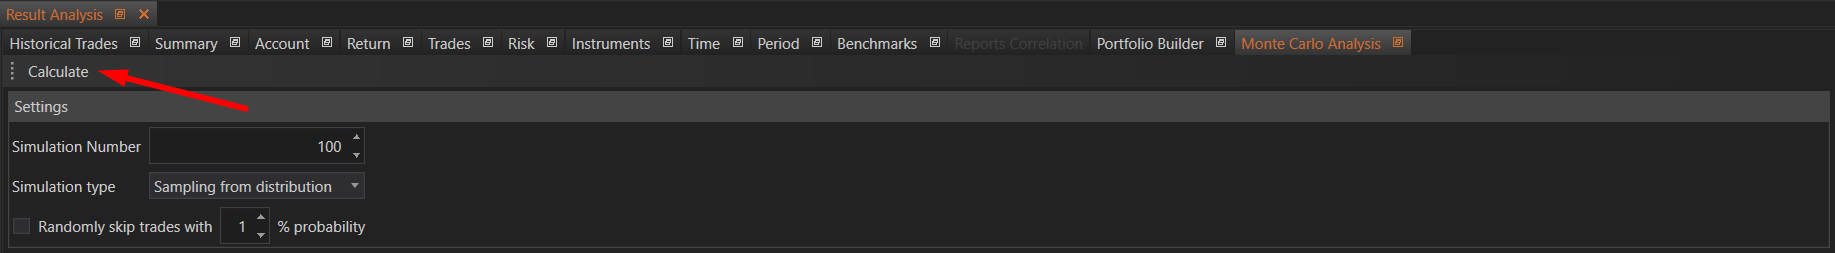
Settings
Simulation Number
- Description: The number of report simulations to run. For example, if Simulation Number is set to 100, it will simulate 100 different reports with the same number of trades as the initial one.
Simulation Type
- Options:
- Sampling from Distribution: Simulate new report trades using a normal distribution based on the initial trades (default method).
- Exact: Simulate exactly the same trades that are in the initial report.
- Resampling: Simulate by randomly selecting from initial trades.
- Randomly Skip Trades with Some Probability %: Allows random skipping of trades to improve the simulation.
- Sampling from Distribution: Simulate new report trades using a normal distribution based on the initial trades (default method).
Usage
- Set the Simulation Settings: Configure the simulation number, type, and other relevant settings.
- Run the Simulation: Click on the "Calculate" button to start the Monte Carlo simulation.
- Analyze the Results: Review the simulation results in the Results with Confidence Level, Monte Carlo Charts, and Risk of Ruin tabs to understand the potential performance and risks of the strategy.
Simulation Results
The results of the simulation are presented in three tabs: Results with Confidence Level, Monte Carlo Charts, and Risk of Ruin.
Results with Confidence Level
The "Results with Confidence Level" tab provides a detailed table that summarizes the statistical outcomes of the simulated strategies across different confidence levels. This tab helps users understand the range of potential outcomes for their trading strategy based on historical data and simulated scenarios.
This table provides statistical information for the simulations.
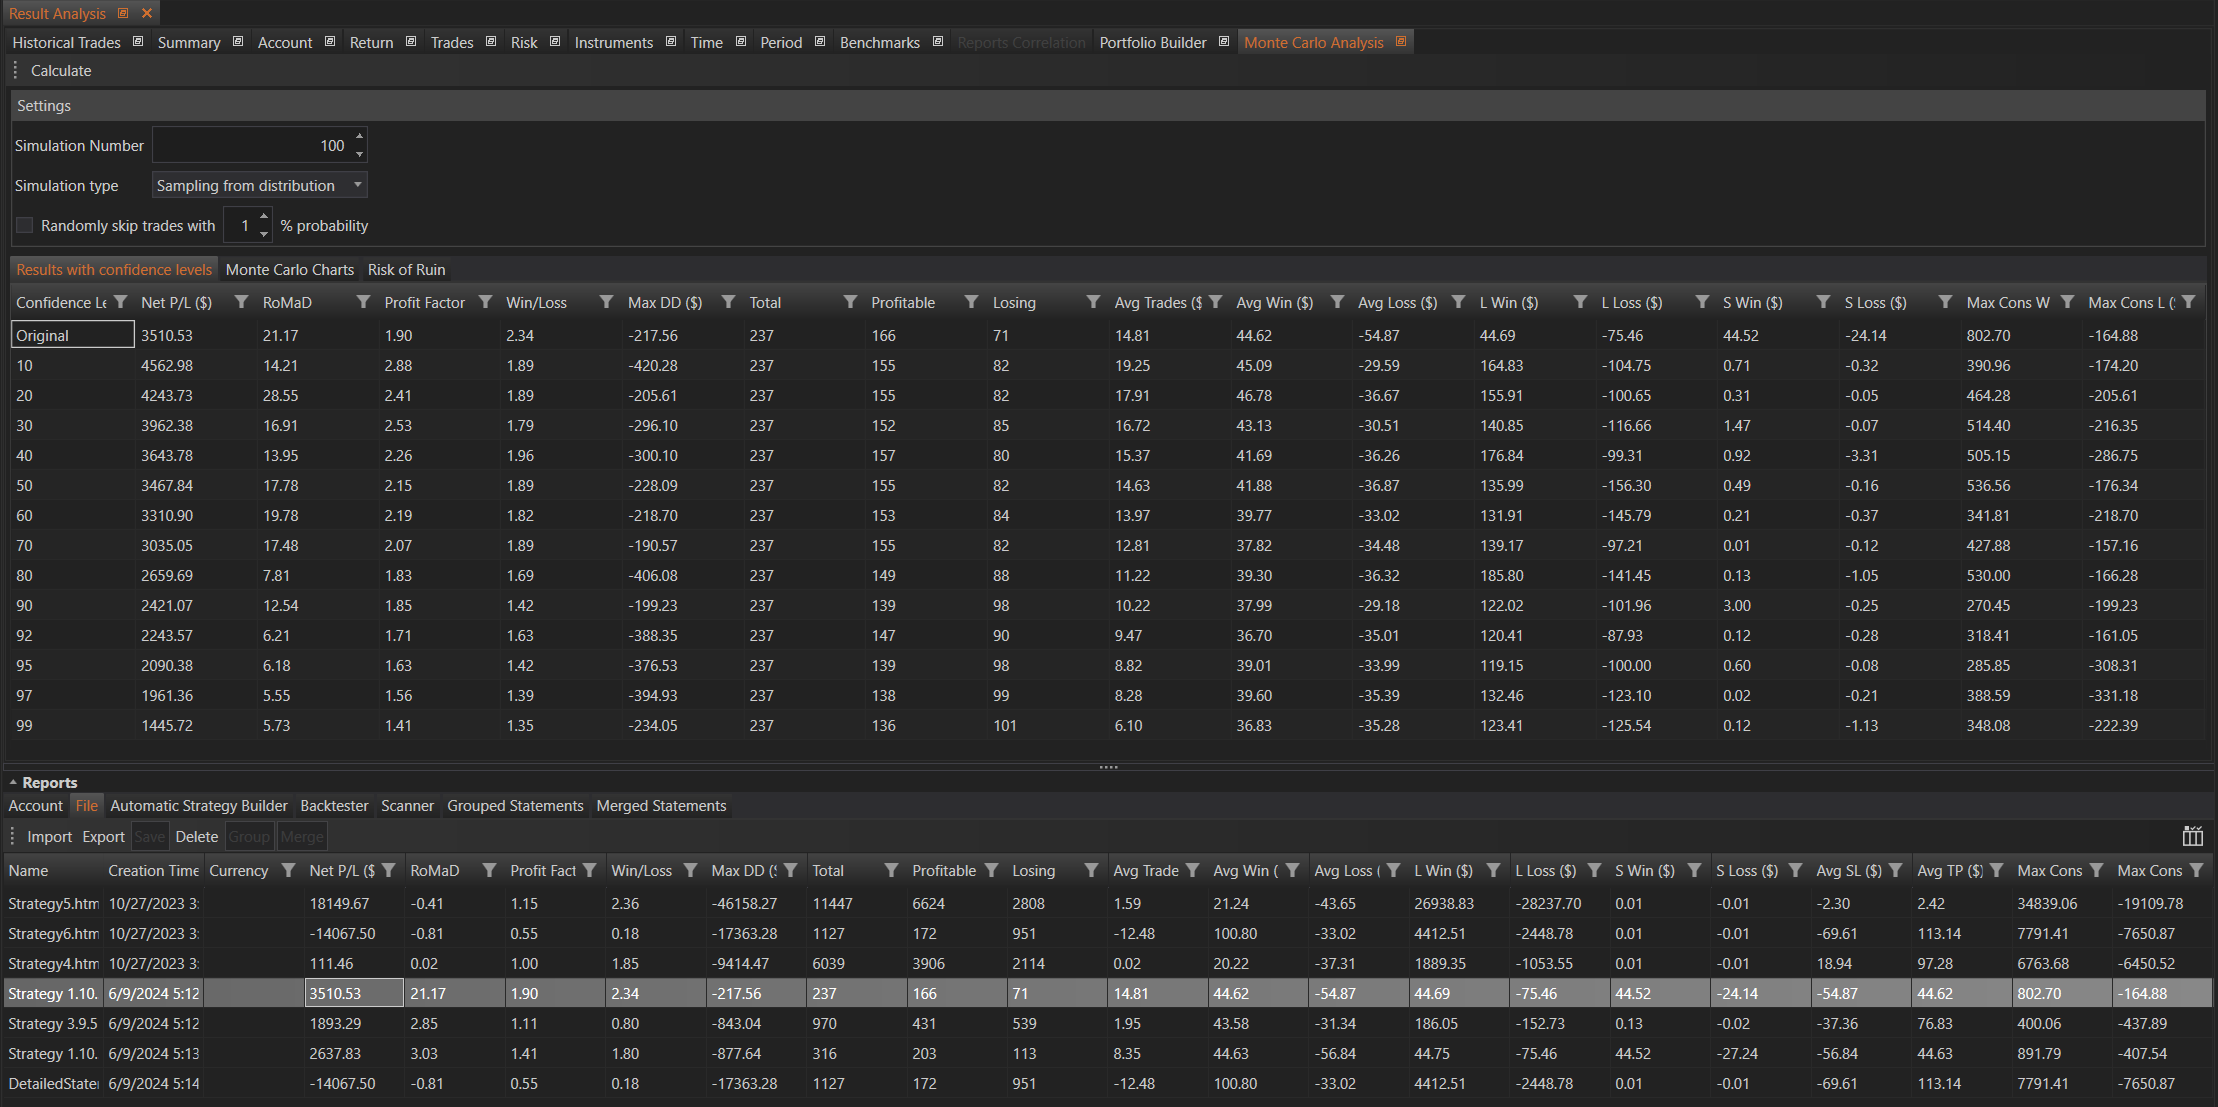
Columns
- Confidence Level: Indicates the simulation quintile. For instance, a Confidence Level of 10 means that only in 10% of cases the strategy will have a better result than presented. A Confidence Level of 99 means that only in 1% of cases the strategy will have a worse result than presented.
- Net P/L: Net profit/loss of the simulated strategy.
- RoMaD: Return to maximum drawdown ratio.
- Profit Factor: Profit factor of the simulated strategy.
- Win/Loss: Winning to losing trades ratio.
- Max DD: Maximum drawdown.
- Total: Total number of trades.
- Profitable: Total number of profitable trades.
- Losing: Total number of losing trades.
- Avg Trade: Average trade P/L.
- Avg Win: Average winning trade profit.
- Avg Loss: Average losing trade loss.
- L Win: The largest winning trade profit.
- L Loss: The largest losing trade profit.
- S Win: The smallest winning trade profit.
- S Loss: The smallest losing trade profit.
- Max Cons W: Maximum consecutive profit.
- Max Cons L: Maximum consecutive loss.
This tab is crucial for understanding the variability and potential outcomes of your trading strategy under different market conditions.
Monte Carlo Charts
The Monte Carlo Charts provide a visual representation of the simulation results, helping users to see the distribution and trends of potential outcomes.
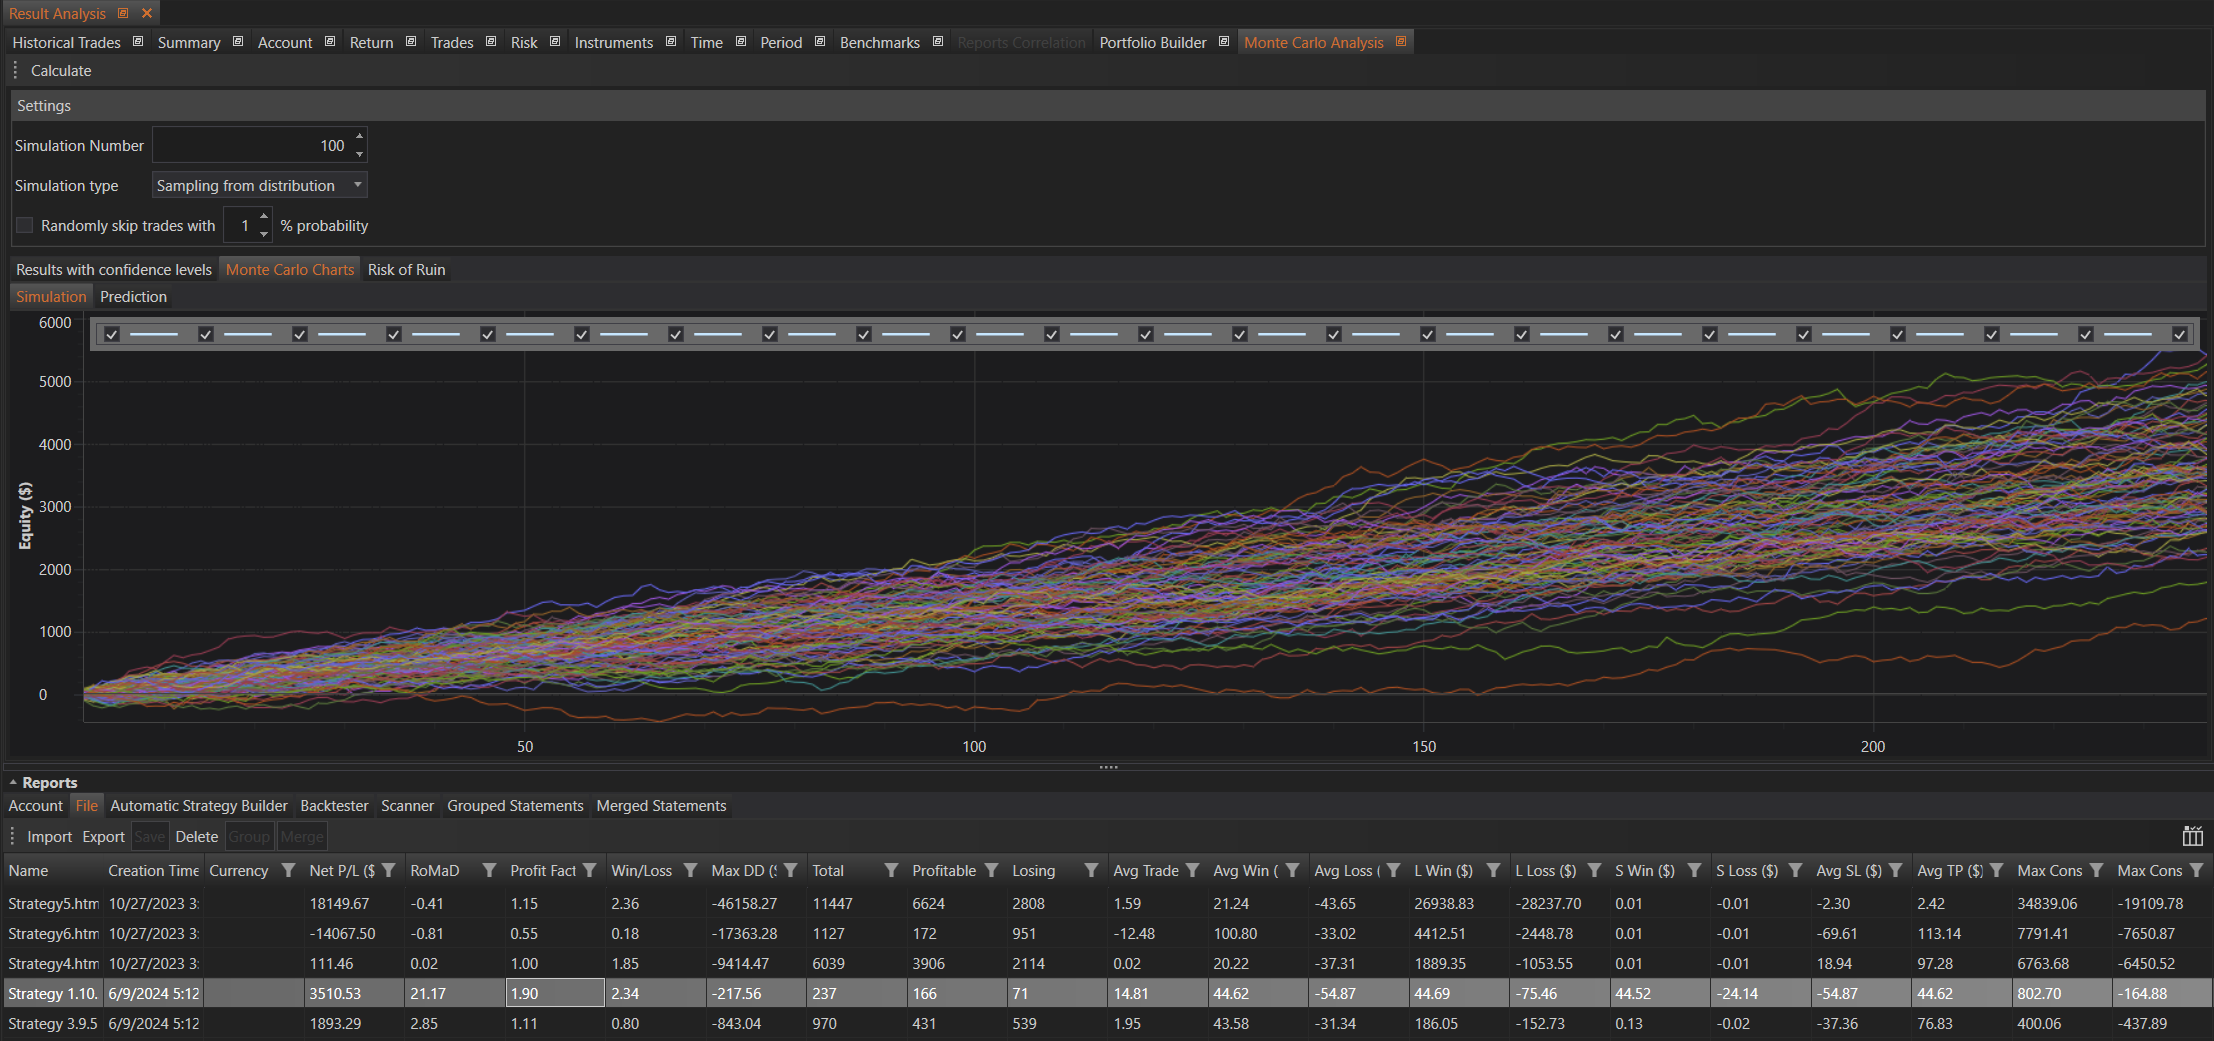
Simulation Chart
The Simulation Chart shows the cumulative profit and loss (P/L) for all simulated scenarios. Each line represents a different simulation, illustrating how the portfolio might perform under various conditions.
- Purpose: This chart helps to visualize the range of possible outcomes and the variability in the strategy's performance.
- Insight: By analyzing the spread and trends of the lines, users can assess the robustness of their strategy. A tighter cluster of lines indicates more consistent performance, while a wider spread suggests higher variability and risk.
This tab contains graphical representations of cumulative P/L for all simulations.
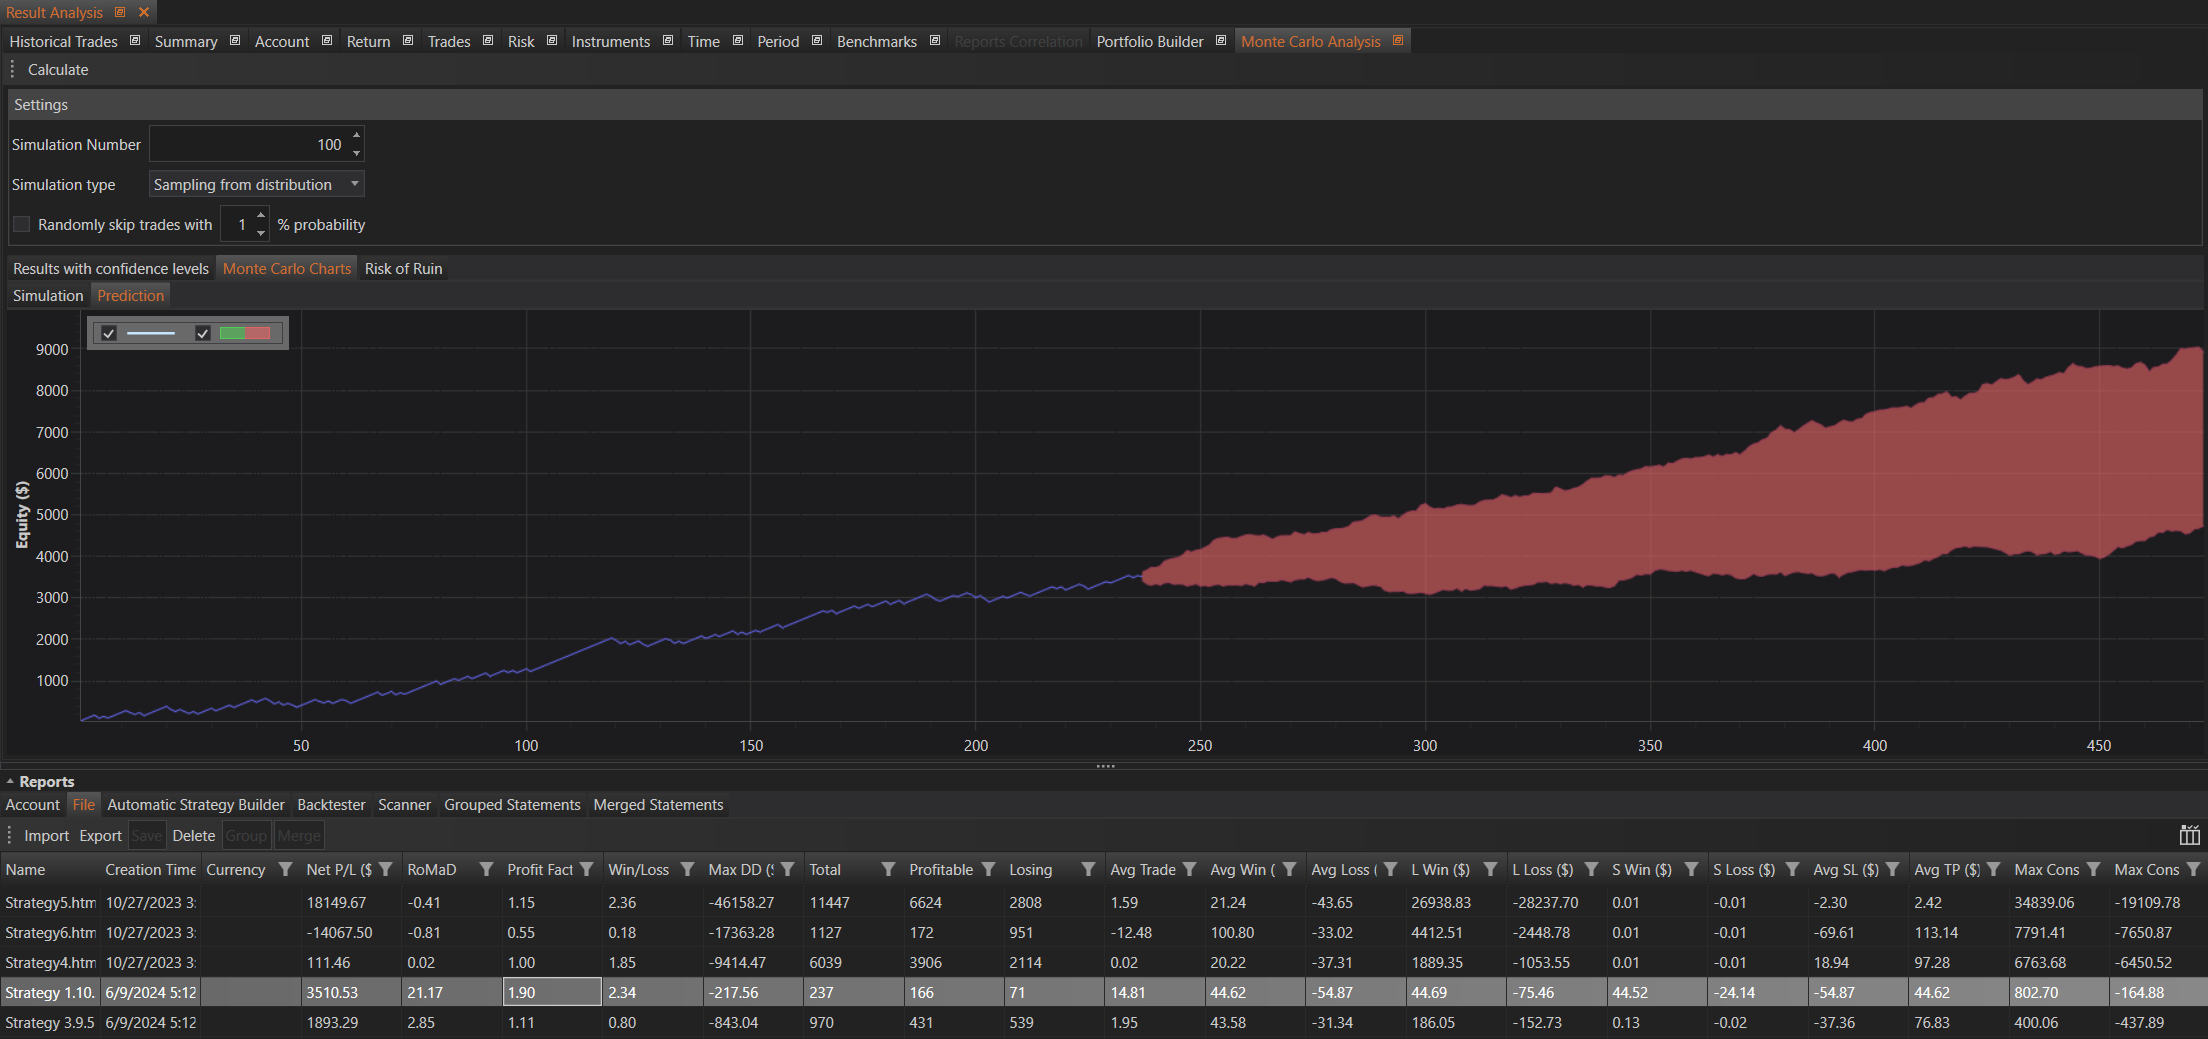
Prediction Chart
The Prediction Chart displays the cumulative P/L along with a shaded area representing the confidence intervals of the predictions. The confidence intervals provide a range within which the true performance is likely to fall with a certain probability.
- Purpose: To provide a probabilistic forecast of the strategy's performance, highlighting the uncertainty and potential risk.
- Insight: The shaded area helps users to understand the potential variability and risk associated with their strategy. A narrow shaded area indicates high confidence in the predictions, while a wider shaded area suggests greater uncertainty.
Risk of Ruin
The Risk of Ruin tab provides a table that shows the probability of losing all initial capital (going broke) based on different initial capital amounts and simulation outcomes.
This tab provides a table with the risk of ruin for a given confidence level, depending on the initial capital.
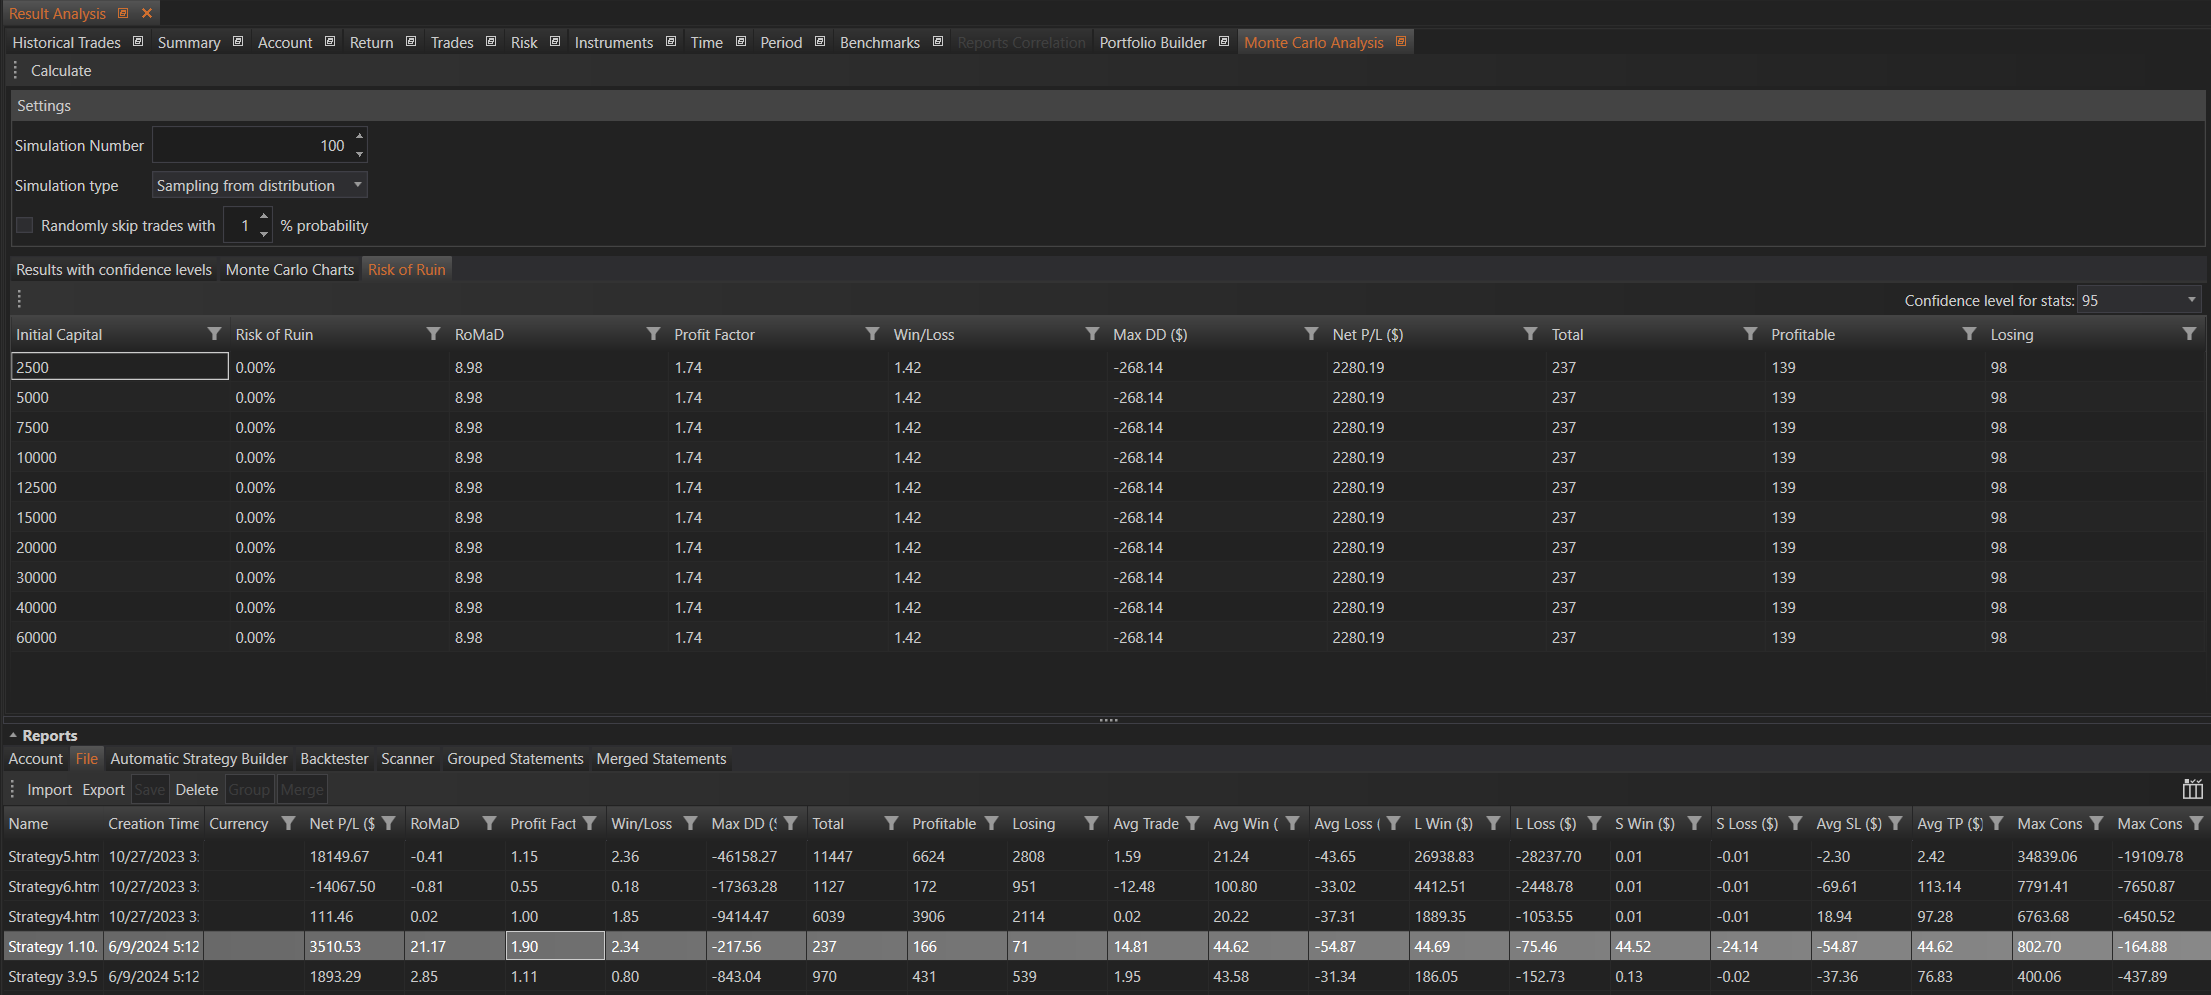
Columns
- Initial Capital: The starting capital for the analysis.
- Risk of Ruin: The probability of losing all capital.
- RoMaD: Return to maximum drawdown ratio.
- Profit Factor: Profit factor of the simulated strategy.
- Win/Loss: Winning to losing trades ratio.
- Max DD: Maximum drawdown.
- Net P/L: Net profit/loss of the simulated strategy.
- Total: Total number of trades.
- Profitable: Total number of profitable trades.
- Losing: Total number of losing trades.
This tab is crucial for understanding the potential risk of a complete loss of capital and helps in making informed decisions about initial capital allocation and risk management.
The Monte Carlo Analysis module is a powerful tool to gain insights into the robustness and risk profile of trading strategies under various simulated scenarios.