The Period section within the Result Analysis module of FinStudio provides detailed statistics of trading strategies broken down by various periods, such as years, quarters, months, days, and hours. This section helps traders analyze their performance over different time frames, offering insights into how time affects trading outcomes.
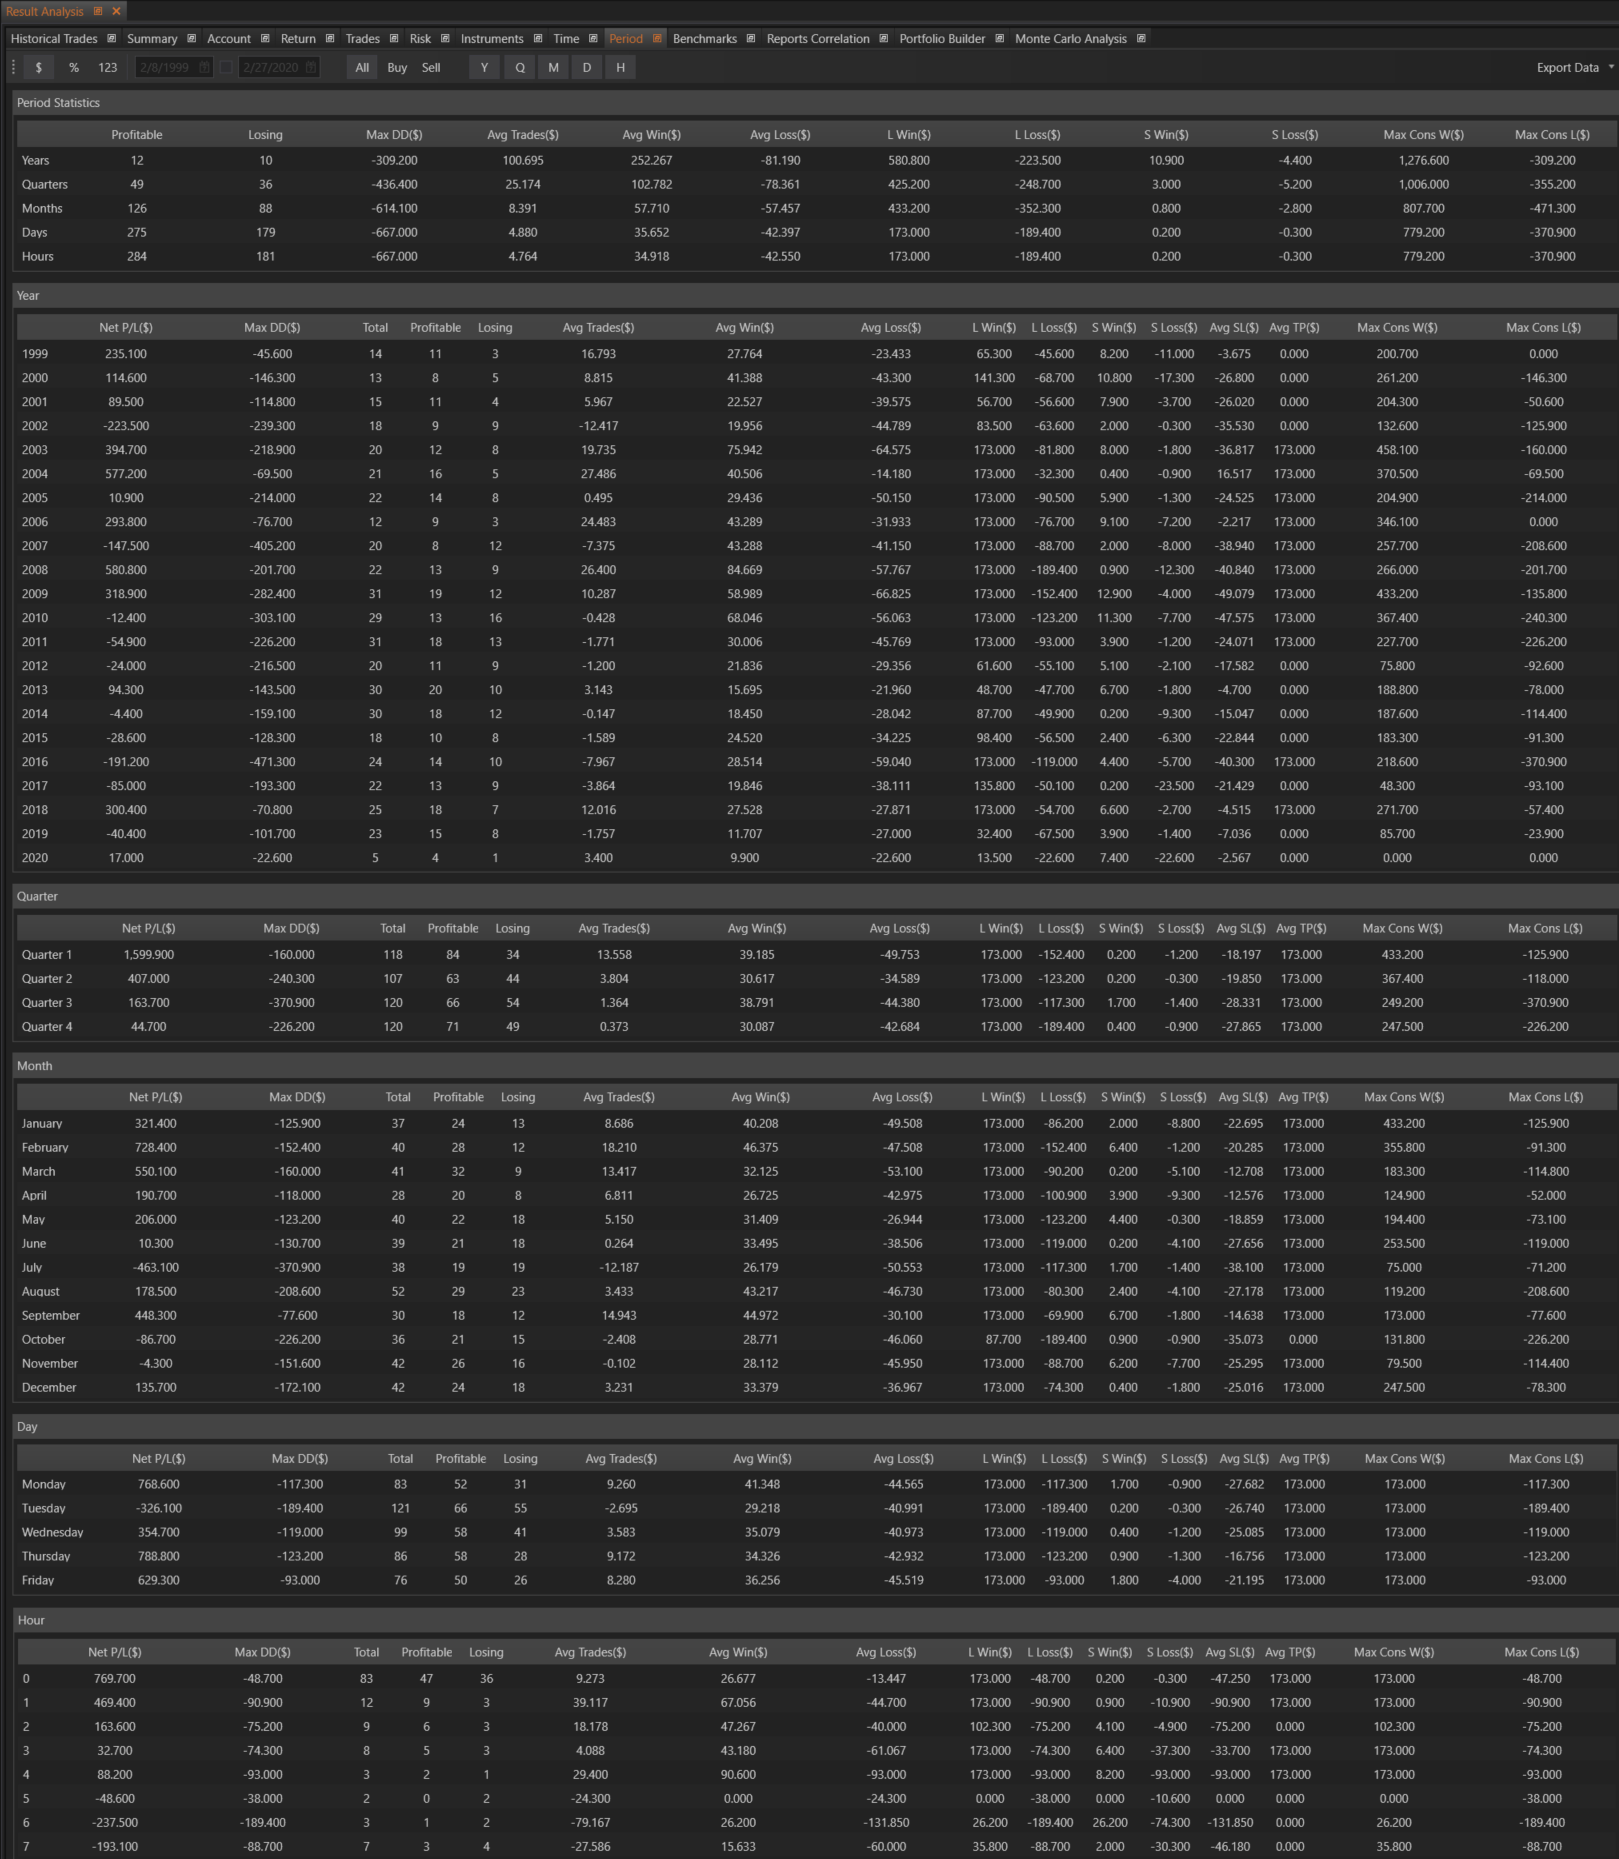
Period Statistics
This table provides a comprehensive overview of strategy statistics segmented by different periods.
Rows
- Years: Yearly strategy statistics.
- Quarters: Quarterly strategy statistics.
- Months: Monthly strategy statistics.
- Days: Daily strategy statistics.
- Hours: Hourly strategy statistics.
Columns
- Profitable: Number of profitable trades.
- Losing: Number of losing trades.
- Max DD ($): Maximum drawdown.
- Avg Trades ($): Average profit per trade.
- Avg Win ($): Average profit of winning trades.
- Avg Loss ($): Average loss of losing trades.
- L Win ($): Largest profit of a winning trade.
- L Loss ($): Largest loss of a losing trade.
- S Win ($): Smallest profit of a winning trade.
- S Loss ($): Smallest loss of a losing trade.
- Max Cons W ($): Maximum profit from consecutive winning trades.
- Max Cons L ($): Maximum loss from consecutive losing trades.
Period-Specific Tables
This feature includes detailed tables with statistics grouped by specific periods, allowing for a deep dive into performance metrics.
Year
- Yearly Statistics: Table with detailed statistics grouped by years.
Quarter
- Quarterly Statistics: Table with detailed statistics grouped by quarters.
Month
- Monthly Statistics: Table with detailed statistics grouped by months.
Day
- Daily Statistics: Table with detailed statistics grouped by days of the week.
Hour
- Hourly Statistics: Table with detailed statistics grouped by hours of the day.
Columns
In addition to the columns found in the Period Statistics table, these tables include:
- Net P/L ($): Net profit-loss value.
- Total: Total number of trades.
Benefits
- Detailed Time-Based Analysis: Provides comprehensive insights into trading performance across various time frames.
- Performance Evaluation: Helps traders identify trends and patterns in profitability and losses over different periods.
- Risk Assessment: Offers maximum drawdown data to assist in risk management.
- Trade Efficiency: Analyzes average trade profitability and loss to evaluate the efficiency of trading strategies.
- Trend Identification: Helps in spotting performance trends during specific periods, aiding in strategic adjustments.
The Period section is designed to offer traders a thorough understanding of their performance across different time frames. By leveraging the detailed insights provided, traders can optimize their strategies, manage risks more effectively, and achieve better trading outcomes.