The Reports Correlation tab within the Result Analysis module allows users to analyze how different reports correlate with each other and determine the number of overlapping trades in the reports. The main purpose of this module is to facilitate the analysis of a portfolio of reports.
Overview
Creating and Selecting Portfolios
To use the Reports Correlation module, users need to create a portfolio of reports (or a Merged Report) or select an existing one from the Merged Reports tab. For more information on Merged Reports and how to create them, please visit Merged Reports.
Setting Parameters
Correlation Period
The time period for which the calculations are performed. Options include:
- Minute
- Hour
- Day
- Week
- Month
Correlation Variable
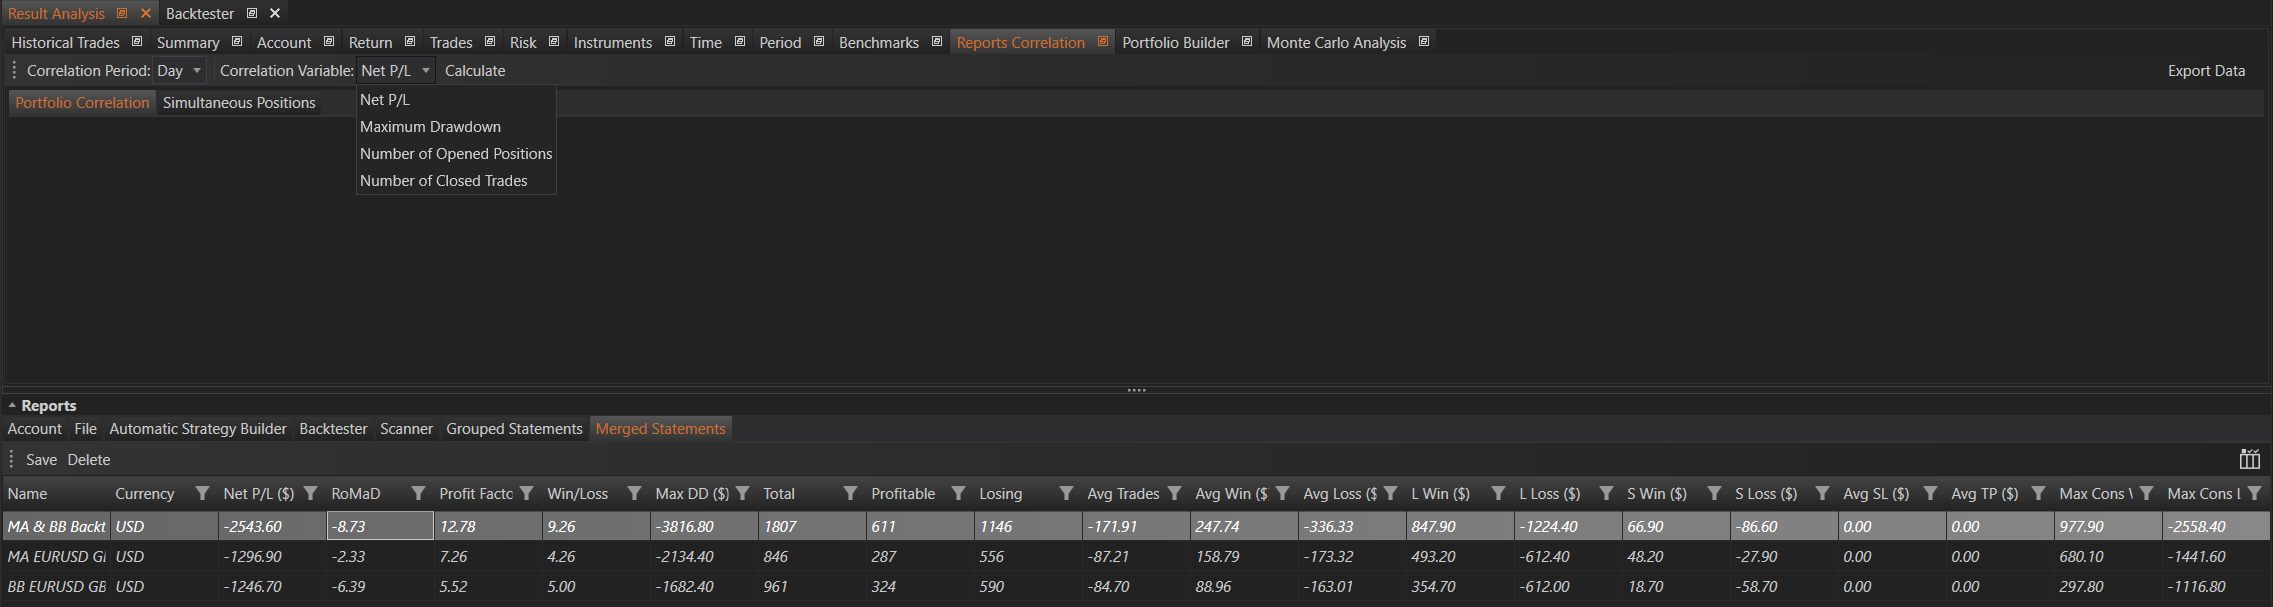
The variable values used for correlation calculation. Options include:
- Net P/L: The net profit or loss, which measures the overall profitability of each strategy.
- Definition: Measures the overall profitability of each strategy. It is the total profit minus the total loss over the specified period.
- Significance:
- Helps in understanding how profit or loss from different strategies moves together.
- Identifies if combining certain strategies will smoothen the overall portfolio performance or increase risk.
- Helps in understanding how profit or loss from different strategies moves together.
- Definition: Measures the overall profitability of each strategy. It is the total profit minus the total loss over the specified period.
- Maximum Drawdown: The largest peak-to-trough decline during the reporting period, reflecting the maximum loss from the highest point before a new peak is achieved.
- Definition: The largest peak-to-trough decline during the reporting period, reflecting the maximum loss from the highest point before a new peak is achieved.
- Significance:
- Shows the risk of significant losses for different strategies.
- Helps in assessing the worst-case scenarios for combined strategies, aiding in risk management and capital allocation.
- Shows the risk of significant losses for different strategies.
- Definition: The largest peak-to-trough decline during the reporting period, reflecting the maximum loss from the highest point before a new peak is achieved.
- Number of Opened Positions: The count of positions opened within the selected period, indicating the trading activity level.
- Definition: The count of positions opened within the selected period, indicating the trading activity level.
- Significance:
- Provides insight into the trading frequency and aggressiveness of different strategies.
- Helps in understanding if high trading activity correlates with higher or lower profitability and risk.
- Provides insight into the trading frequency and aggressiveness of different strategies.
- Definition: The count of positions opened within the selected period, indicating the trading activity level.
- Number of Closed Trades: The count of trades closed within the selected period, providing insight into the trading turnover and frequency.
- Definition: The count of trades closed within the selected period, providing insight into the trading turnover and frequency.
- Significance:
- Indicates the strategy's turnover rate, helping to understand its trading style.
- Helps in correlating the frequency of closing trades with overall strategy performance, aiding in strategy optimization.
- Indicates the strategy's turnover rate, helping to understand its trading style.
- Definition: The count of trades closed within the selected period, providing insight into the trading turnover and frequency.
Result
The result of the calculations includes two tables: Portfolio Correlation and Simultaneous Positions.
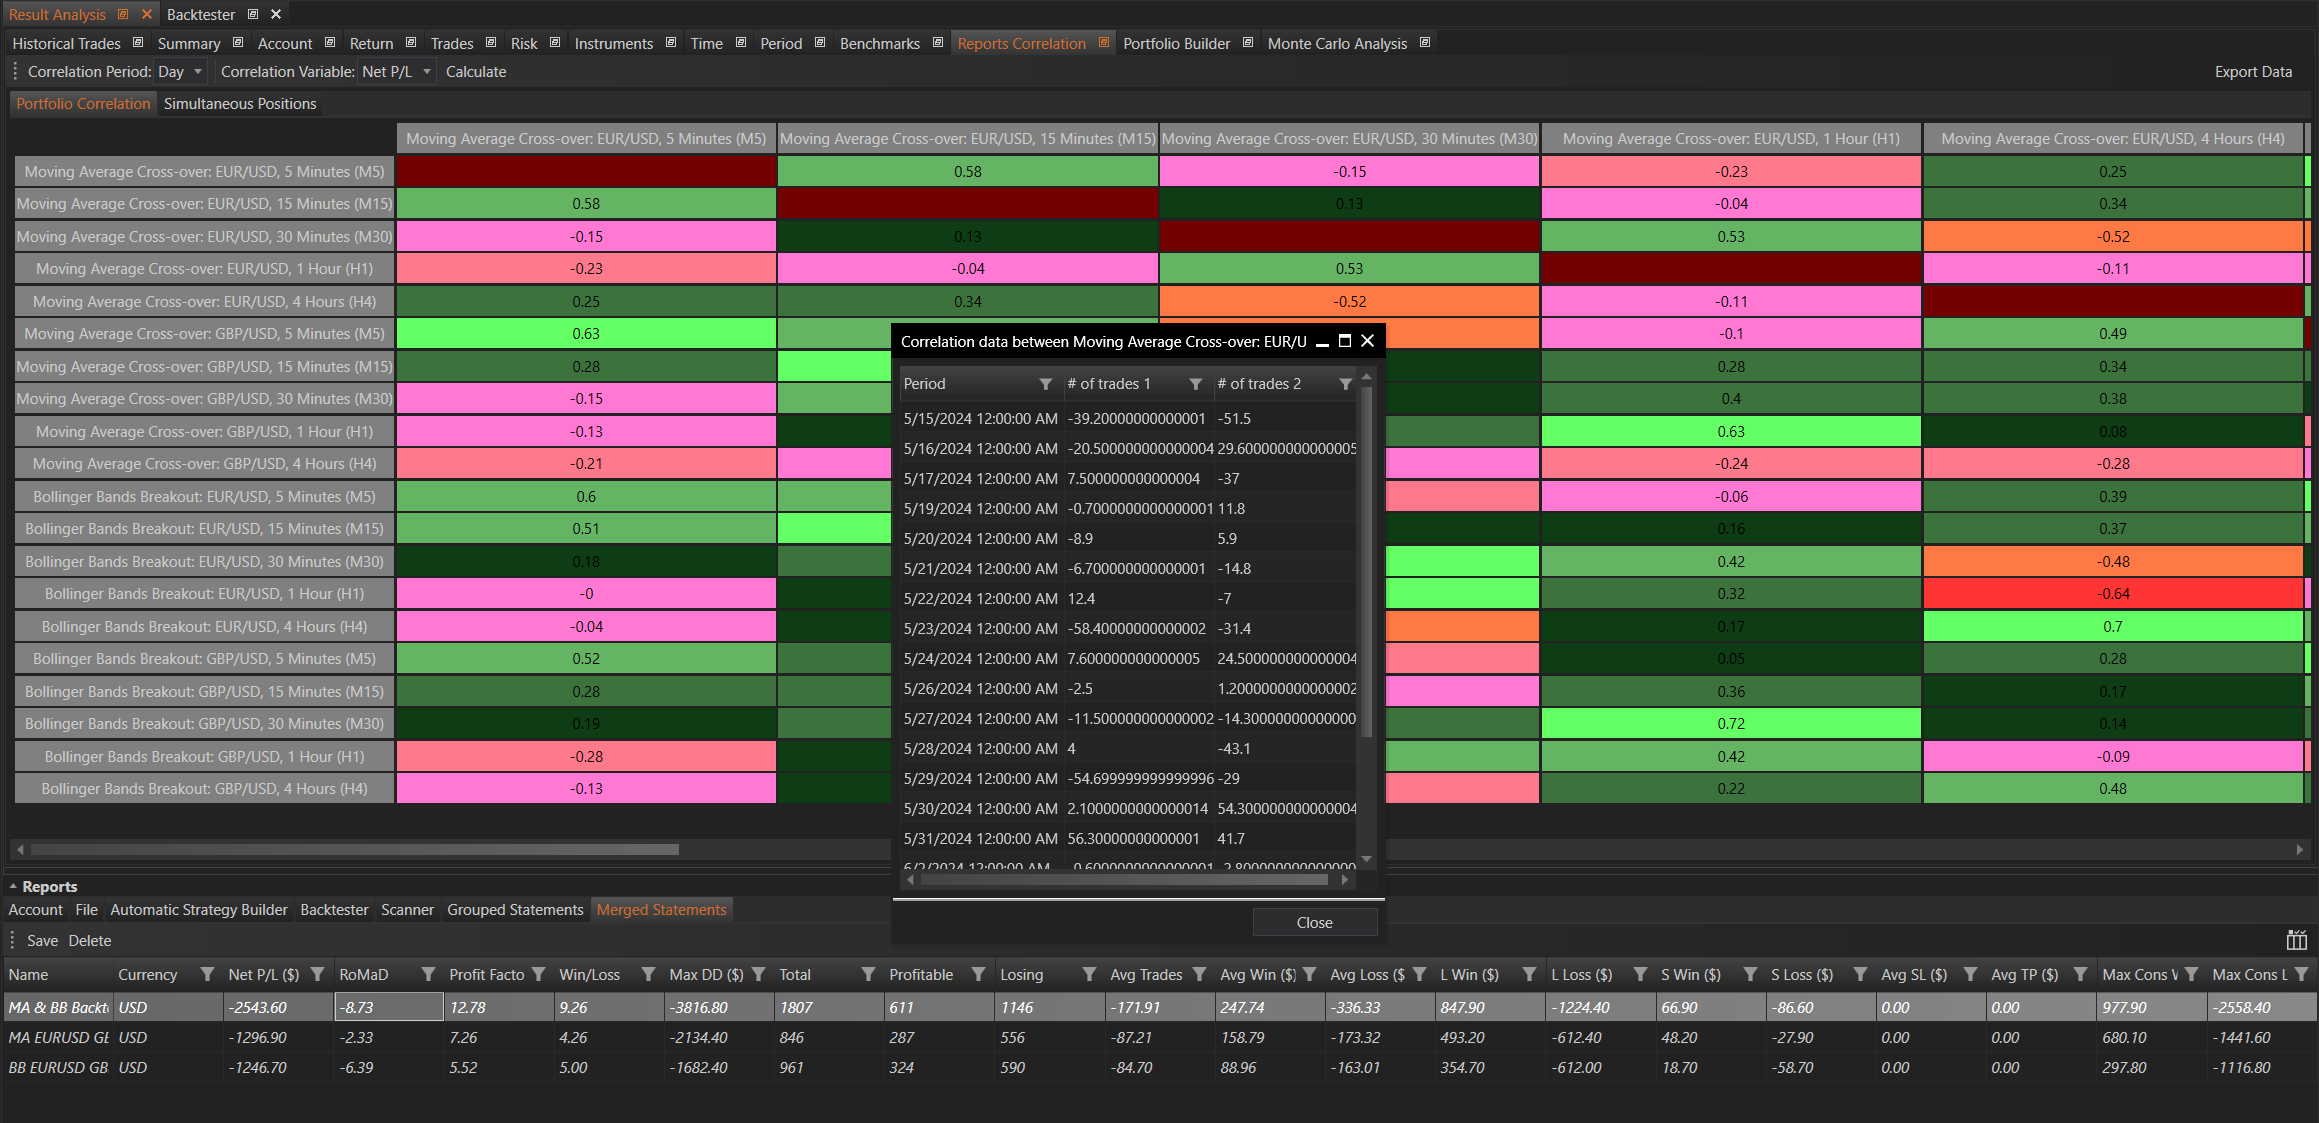
Portfolio Correlation
This is a correlation matrix where each value represents the pairwise correlation coefficient of respective portfolios. Diagonal elements of the matrix are empty. Each non-empty element is clickable. Clicking on an element opens a window with the data on which the correlation coefficient was calculated.
Significance:
- Understanding Relationships: Portfolio Correlation helps traders understand the relationships between different trading strategies. A high correlation indicates that the strategies tend to perform similarly under the same market conditions, while a low or negative correlation suggests diverse performance.
- Risk Management: By analyzing correlations, traders can identify and manage risks associated with having highly correlated strategies that might lead to increased volatility in their portfolios.
- Diversification: Identifying low or negatively correlated strategies can help in diversifying the portfolio, reducing overall risk, and potentially increasing returns.
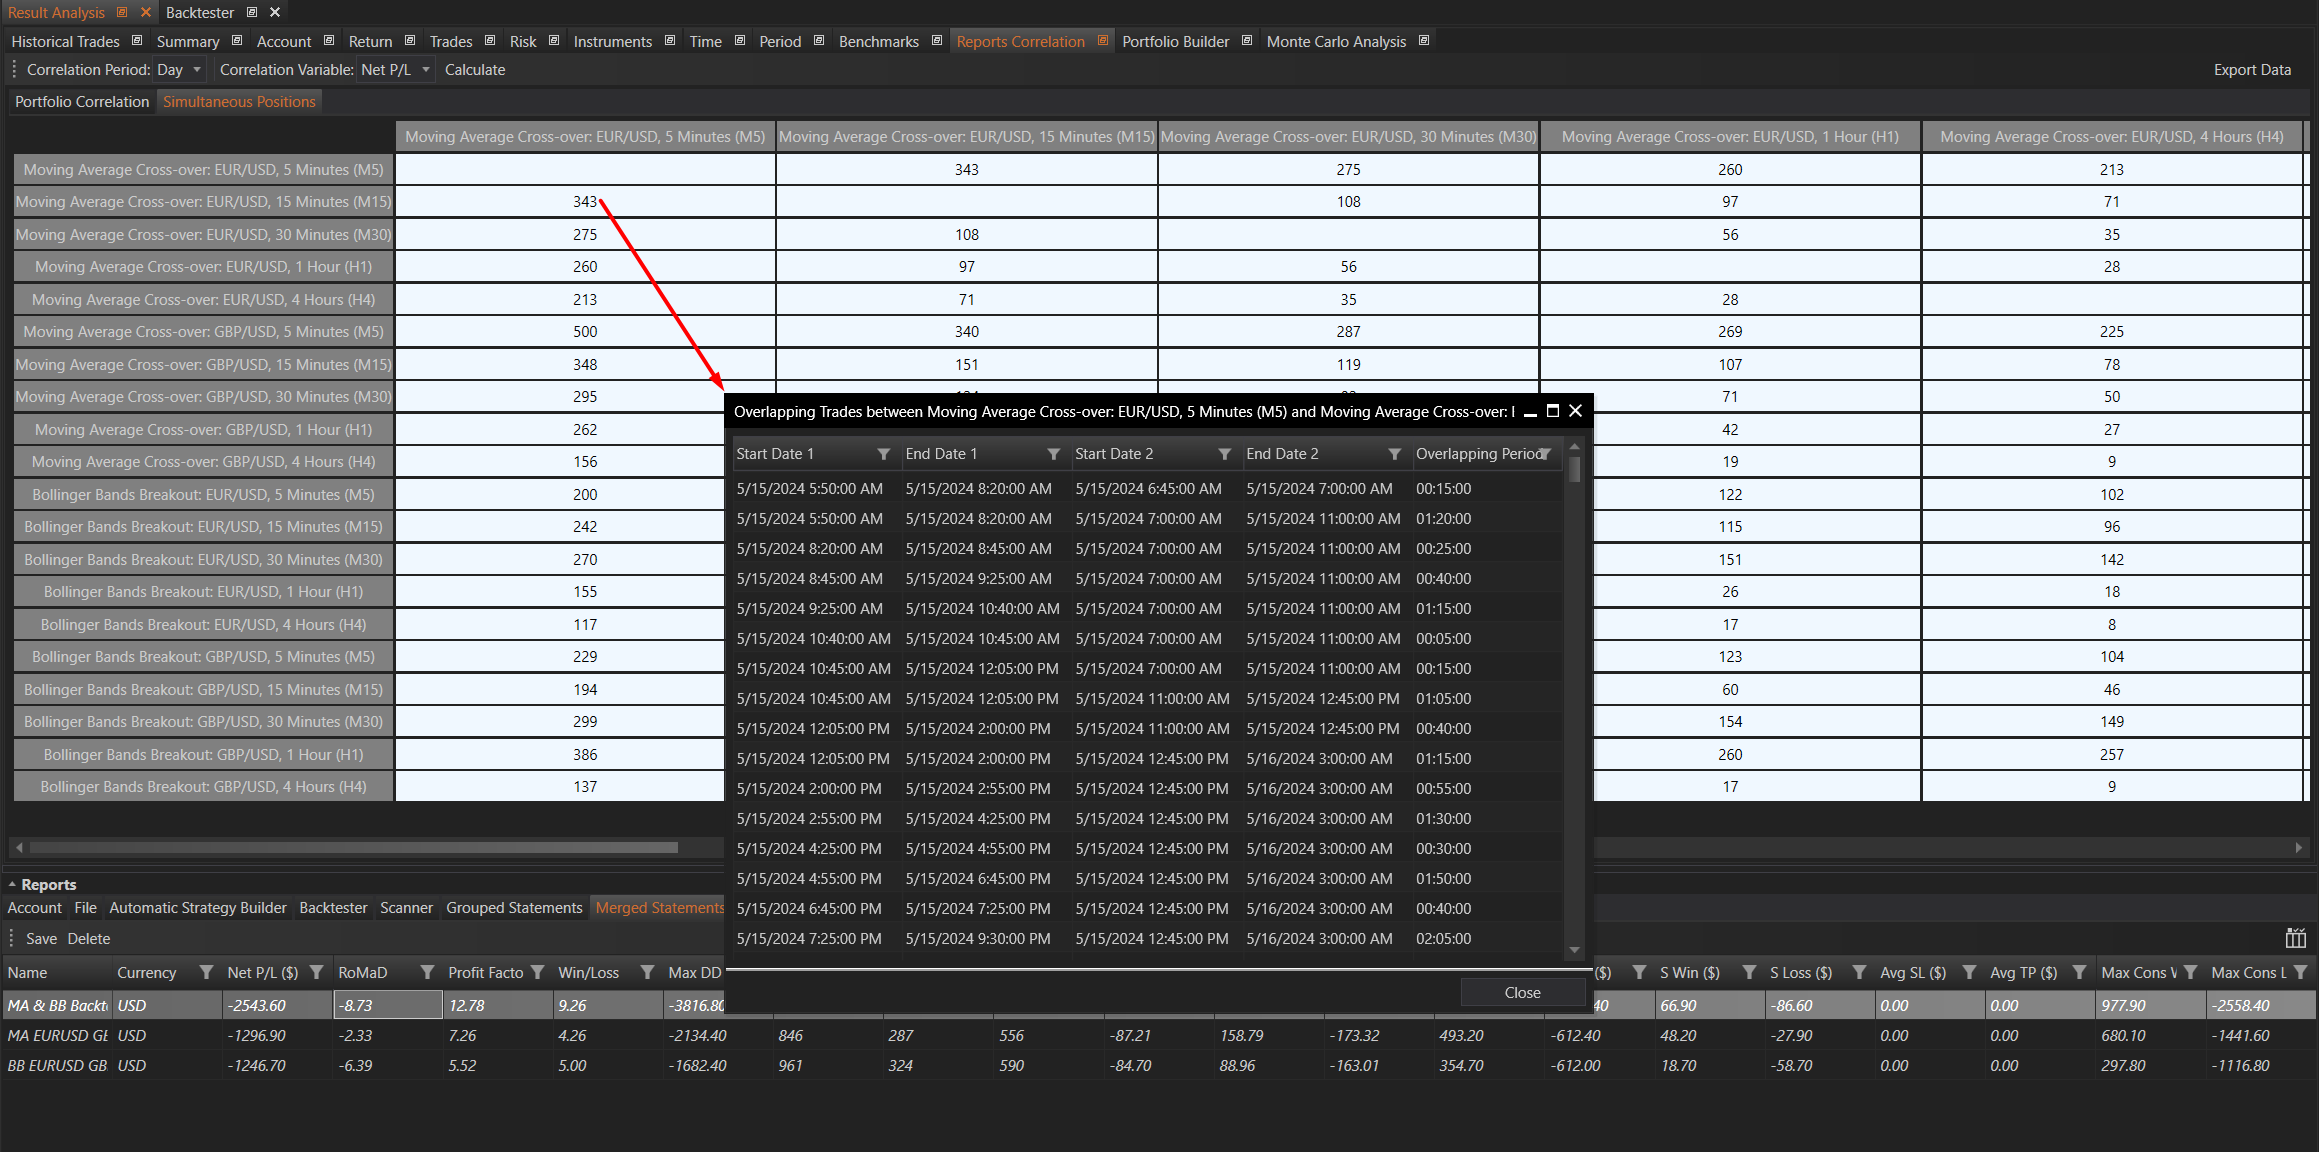
Simultaneous Positions
This is a symmetric matrix where each value represents the number of overlapping trades of respective portfolios. Matrix elements have the same properties as elements in the Portfolio Correlation matrix. Clicking on a non-empty element opens a window with data on the overlapping trades, including their overlapping periods.
Significance:
- Trade Analysis: Simultaneous Positions analysis helps traders understand how often different strategies open trades simultaneously. This can indicate if the strategies are likely to react similarly to market conditions.
- Exposure Management: By examining overlapping trades, traders can manage their exposure to specific market events and avoid over-leveraging by ensuring that not too many positions are open at the same time.
- Strategy Coordination: This analysis can help in coordinating strategies to avoid conflicts and ensure that the combined strategies work harmoniously without causing excessive risk.
Summary
The Reports Correlation tab in the Result Analysis module provides powerful tools for analyzing the relationships between different trading reports. By setting the appropriate parameters and examining the resulting correlation and simultaneous position matrices, users can gain valuable insights into their trading strategies and their performance relative to each other. This helps in making informed decisions to optimize the trading portfolio. The significance of understanding portfolio correlations and simultaneous positions lies in better risk management, improved diversification, and more effective strategy coordination.