The Reports Grid within the Reports section of the Result Analysis module displays a comprehensive set of columns providing detailed information about the trading history and performance metrics. The grid contains various columns as shown in the attached image.
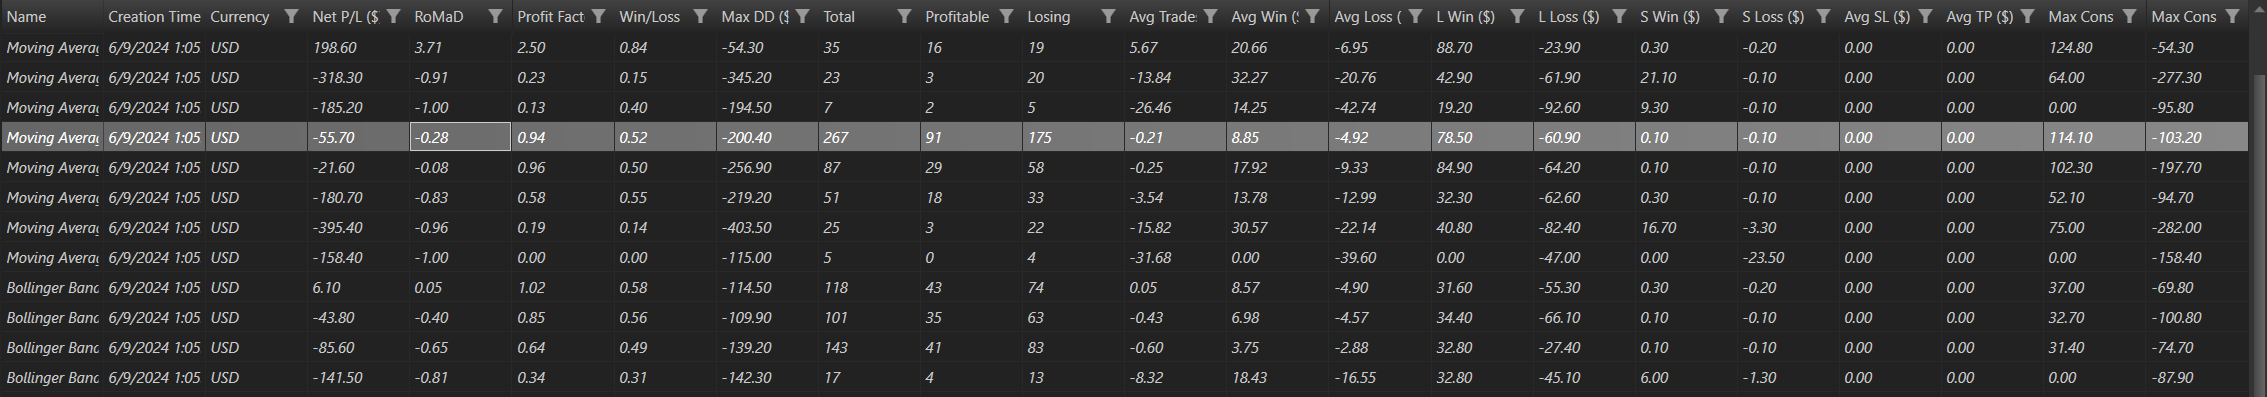
Reports Grid Columns
General Information
- Name: The name of the report or strategy.
- Creation Time: The time at which the report or strategy was created or imported.
- Currency: The main currency of the report.
Performance Metrics
- Net P/L ($): The net profit or loss in dollars.
- RoMaD: Return over Maximum Drawdown, a measure of risk-adjusted return.
- Profit Factor: The ratio of gross profit to gross loss.
- Win/Loss: The ratio of winning trades to losing trades.
- Max DD ($): Maximum Drawdown in dollars, indicating the largest peak-to-trough decline during the reporting period.
Trade Statistics
- Total: The total number of trades.
- Profitable: The number of profitable trades.
- Losing: The number of losing trades.
- Avg Trades ($): The average profit or loss per trade.
- Avg Win ($): The average profit of winning trades.
- Avg Loss ($): The average loss of losing trades.
Largest and Smallest Trades
- L Win ($): The largest winning trade in dollars.
- L Loss ($): The largest losing trade in dollars.
- S Win ($): The smallest winning trade in dollars.
- S Loss ($): The smallest losing trade in dollars.
Stop Loss and Take Profit
- Avg SL ($): The average stop loss value in dollars.
- Avg TP ($): The average take profit value in dollars.
Consecutive Trades
- Max Cons W ($): The maximum profit from consecutive winning trades in dollars.
- Max Cons L ($): The maximum loss from consecutive losing trades in dollars.
Summary
The Reports Grid in the Result Analysis module provides a detailed and comprehensive view of trading performance through various columns. These columns include general information about the report, key performance metrics, trade statistics, details of the largest and smallest trades, and data on stop loss, take profit, and consecutive trades. This extensive information helps users to thoroughly analyze and understand their trading strategies and performance.