The Return section within the Result Analysis module of FinStudio provides a detailed overview of the account's profit and loss (P/L), offering critical insights into the financial outcomes of trading strategies. This section includes comprehensive data, graphical representations, and detailed tables to help traders understand their performance and make informed decisions.
Account P/L
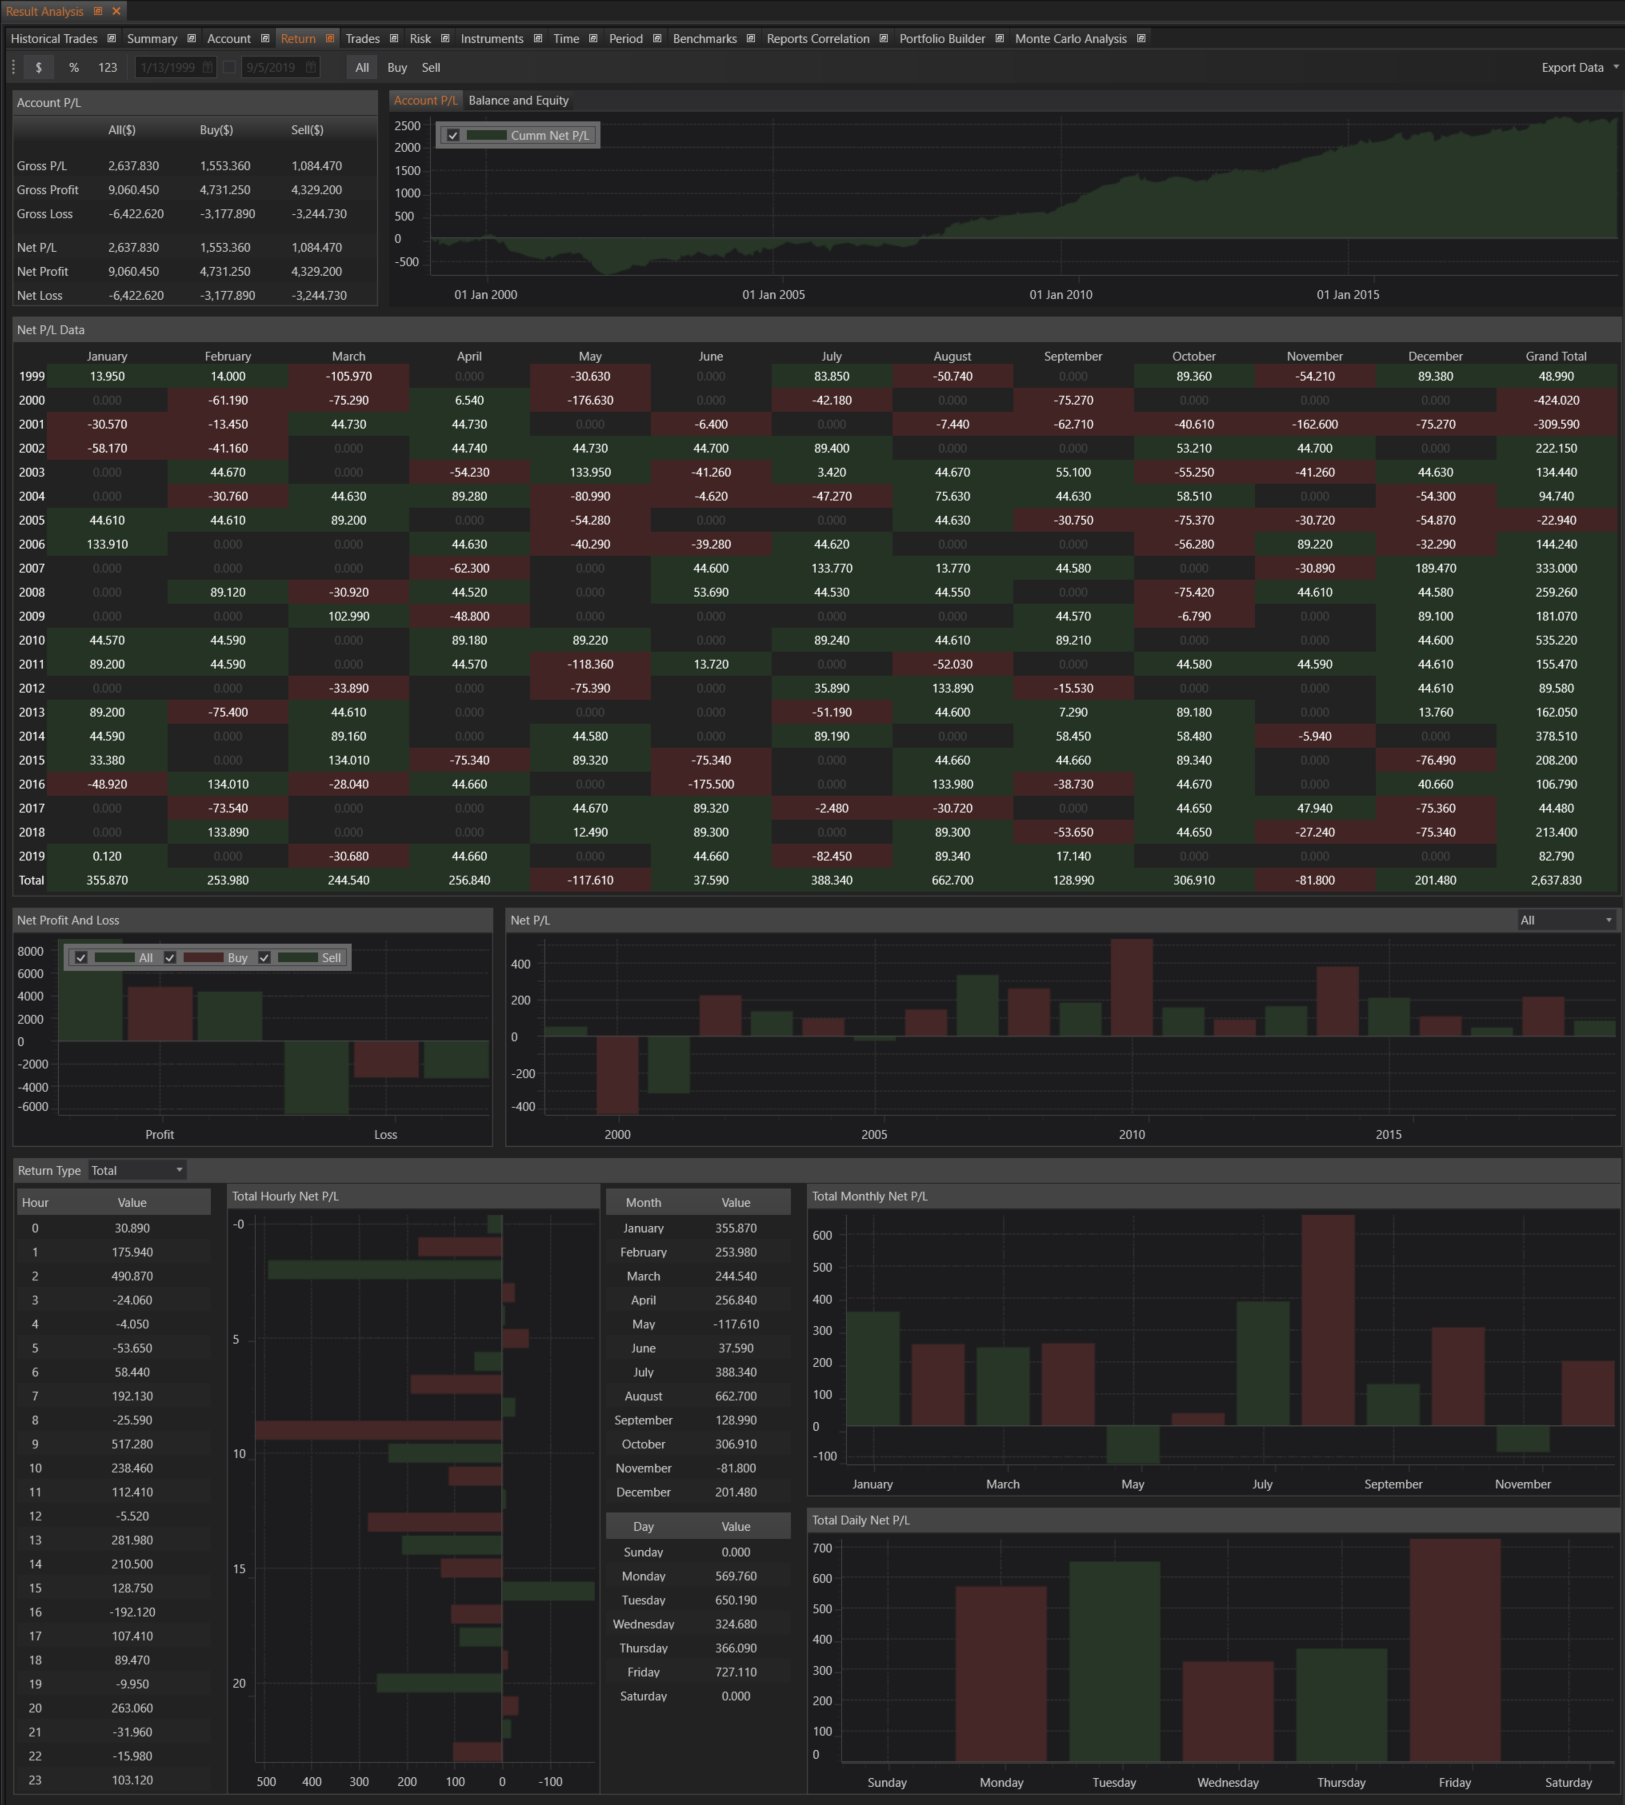
The Account P/L section presents detailed information about the account's profit and loss.
- Gross P/L: Calculated as the difference between Gross Profit and Gross Loss.
- Gross Profit: The total gross profit generated by the strategy.
- Gross Loss: The total gross loss incurred by the strategy.
- Net P/L: Calculated as the difference between Net Profit and Net Loss.
- Net Profit: The net profit of the strategy, which is the Gross Profit minus commissions, swaps, and fees.
- Net Loss: The net loss of the strategy.
Account P/L & Balance & Equity
This section includes graphical representations of the strategy's cumulative profit and loss, balance, and equity over time, providing a visual overview of financial performance.
Net P/L Data
A detailed table presents Net P/L data grouped by year and month, allowing for a time-based analysis of performance.
Net Profit and Loss
Graphical representations of net profit and loss are provided for all trades, long trades, and short trades, helping traders to compare performance across different trade types.
Net P/L
This graphic shows the net profit and loss grouped by year, offering an annual overview of financial performance.
Return (Total or Average)
This section includes graphics of total and average Net P/L grouped by various criteria to provide a comprehensive view of returns.
- Total Hourly Net P/L: Graphics and tables showing total and average Net P/L grouped by the hour of the day.
- Total Monthly Net P/L: Graphics and tables showing total and average Net P/L grouped by the month of the year.
- Total Daily Net P/L: Graphics and tables showing total and average Net P/L grouped by the day of the week.
Benefits
- Detailed Financial Insights: Provides a comprehensive view of profit and loss, helping traders to understand the financial outcomes of their strategies.
- Time-Based Analysis: Yearly and monthly breakdowns of Net P/L data allow for detailed time-based performance analysis.
- Comparative Graphics: Visual representations of P/L and balance provide an easy-to-understand overview of financial performance.
- Return Analysis: Detailed graphics of returns grouped by various criteria help traders to identify patterns and optimize their strategies.
The Result section is designed to offer traders a complete and detailed overview of their financial performance. By leveraging the insights provided, traders can make data-driven decisions, refine their strategies, and achieve better trading outcomes.