The Risk section within the Result Analysis module of FinStudio provides a comprehensive analysis of the risks associated with trading strategies. It includes detailed metrics and graphical representations to help traders understand and manage the risks involved in their trading activities.
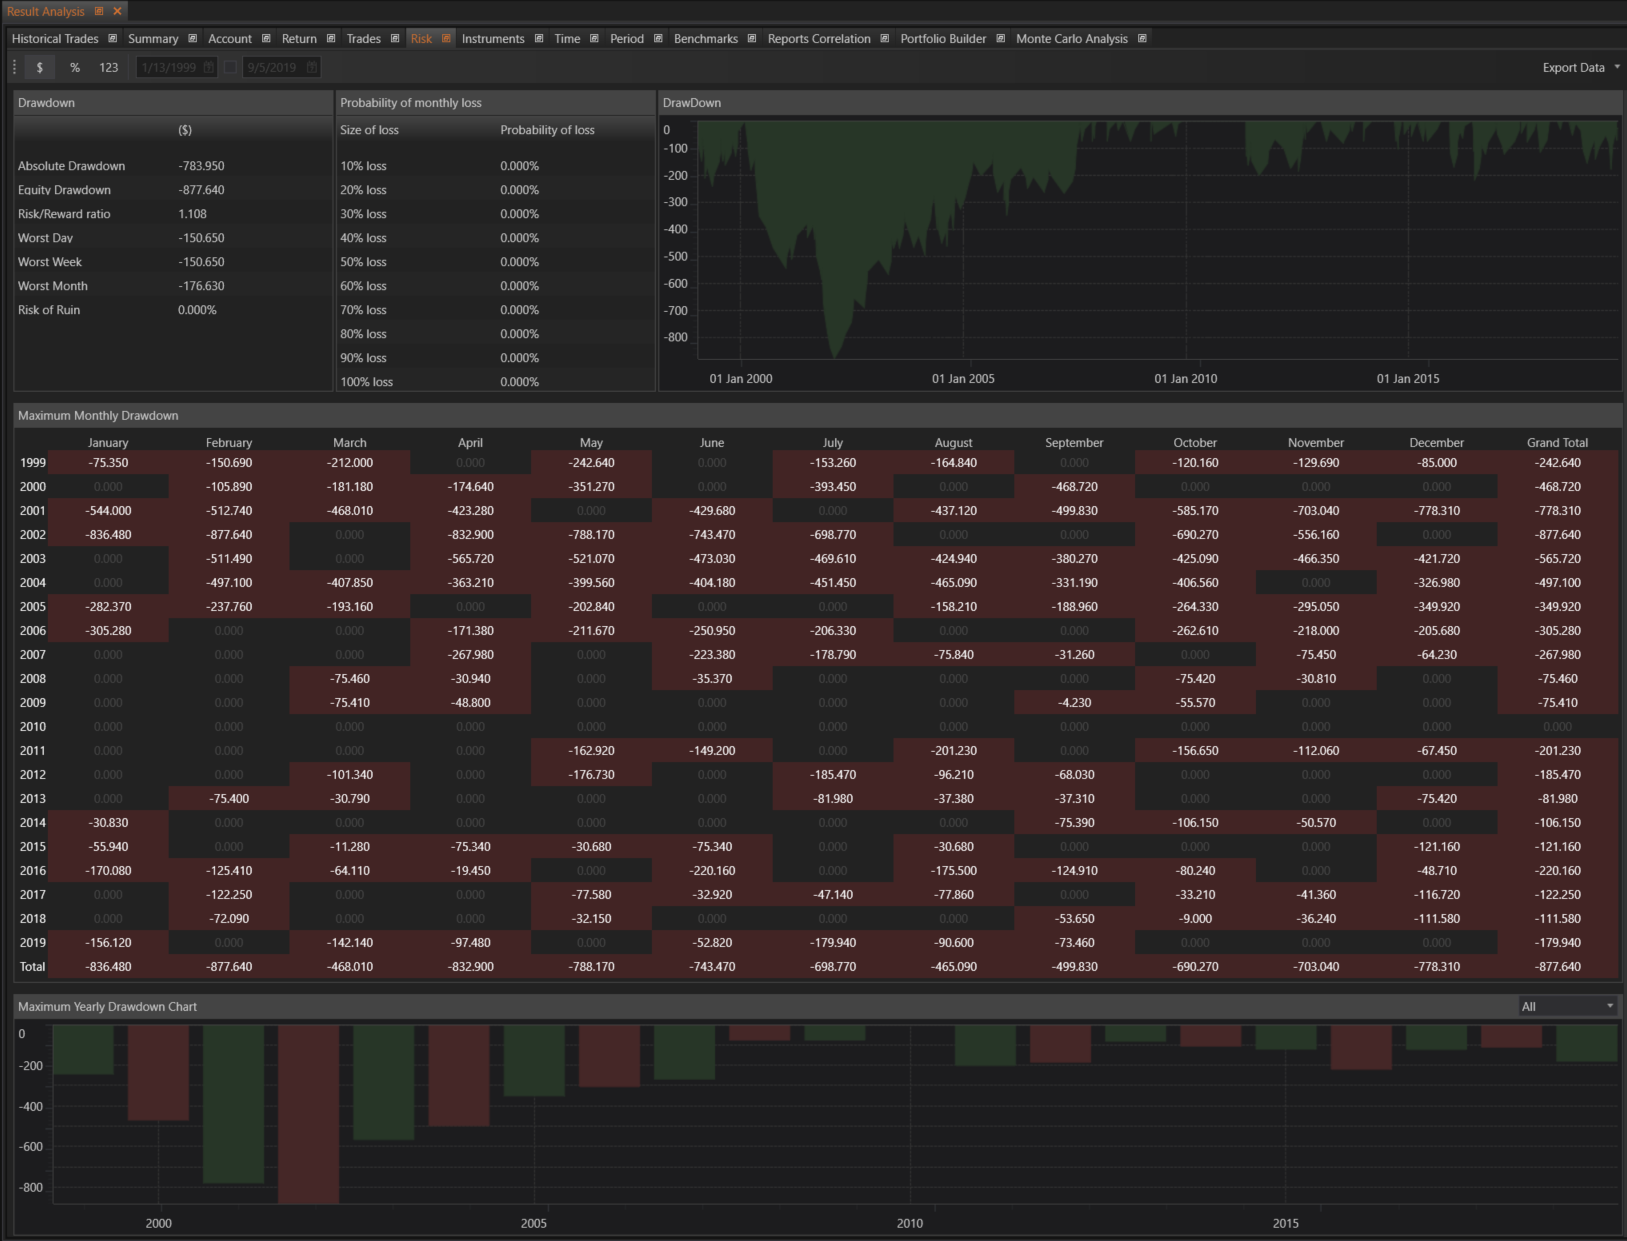
Drawdown
The Drawdown section provides crucial information about the strategy's drawdown, helping traders assess the potential downside risk.
- Absolute Drawdown: The difference between the minimum balance and the initial balance.
- Equity Drawdown: The same as maximum drawdown, indicating the largest peak-to-trough decline in equity.
Risk / Reward Ratio
This metric calculates the risk/reward ratio for trades, providing insights into the potential profitability relative to the risk taken.
- Risk / Reward Ratio: Calculated as (Entry Price - Stop Loss) / (Take Profit - Entry Price).
Worst Periods
This section highlights the periods with the most significant losses, helping traders identify and analyze the worst-performing times.
- Worst Day: The maximum loss incurred in one day.
- Worst Week: The maximum loss incurred in one week.
- Worst Month: The maximum loss incurred in one month.
Risk of Ruin
This metric provides the probability of a trading strategy leading to ruin, a critical risk management indicator.
- Risk of Ruin: The probability that the trading strategy will deplete the account to the point of ruin.
Probability of Monthly Loss
A table that outlines the probability of experiencing different sizes of monthly losses, ranging from 10% to 100%.
- Probability of Monthly Loss: Shows the likelihood of various levels of monthly losses, helping traders understand the risk of adverse outcomes.
Drawdown Graphics
Graphical representations of drawdown provide a visual overview of the strategy's drawdown performance.
- Drawdown Graphics: Visual graphs showing the drawdown over time, highlighting significant declines.
Maximum Monthly Drawdown
A detailed table presents the maximum drawdown grouped by year and month, allowing for time-based risk analysis.
- Maximum Monthly Drawdown: A table showing the maximum drawdown for each month, grouped by year.
Maximum Yearly Drawdown Chart
This graphical representation shows the maximum drawdown grouped by year, providing a long-term view of the strategy's risk performance.
- Maximum Yearly Drawdown Chart: Graphics showing the maximum drawdown for each year.
Benefits
- Comprehensive Risk Analysis: Provides detailed insights into the potential risks associated with trading strategies.
- Risk Management: Helps traders identify and understand the periods of highest risk, aiding in effective risk management.
- Probability Assessment: Offers probability data on monthly losses, assisting traders in preparing for various risk scenarios.
- Visual Tools: Graphical representations make it easier to comprehend drawdown and risk metrics, facilitating better decision-making.
The Risk section is designed to give traders a thorough understanding of the risks inherent in their trading strategies. By leveraging the detailed insights provided, traders can manage risks more effectively, enhance their strategies, and work towards achieving more consistent and profitable outcomes.