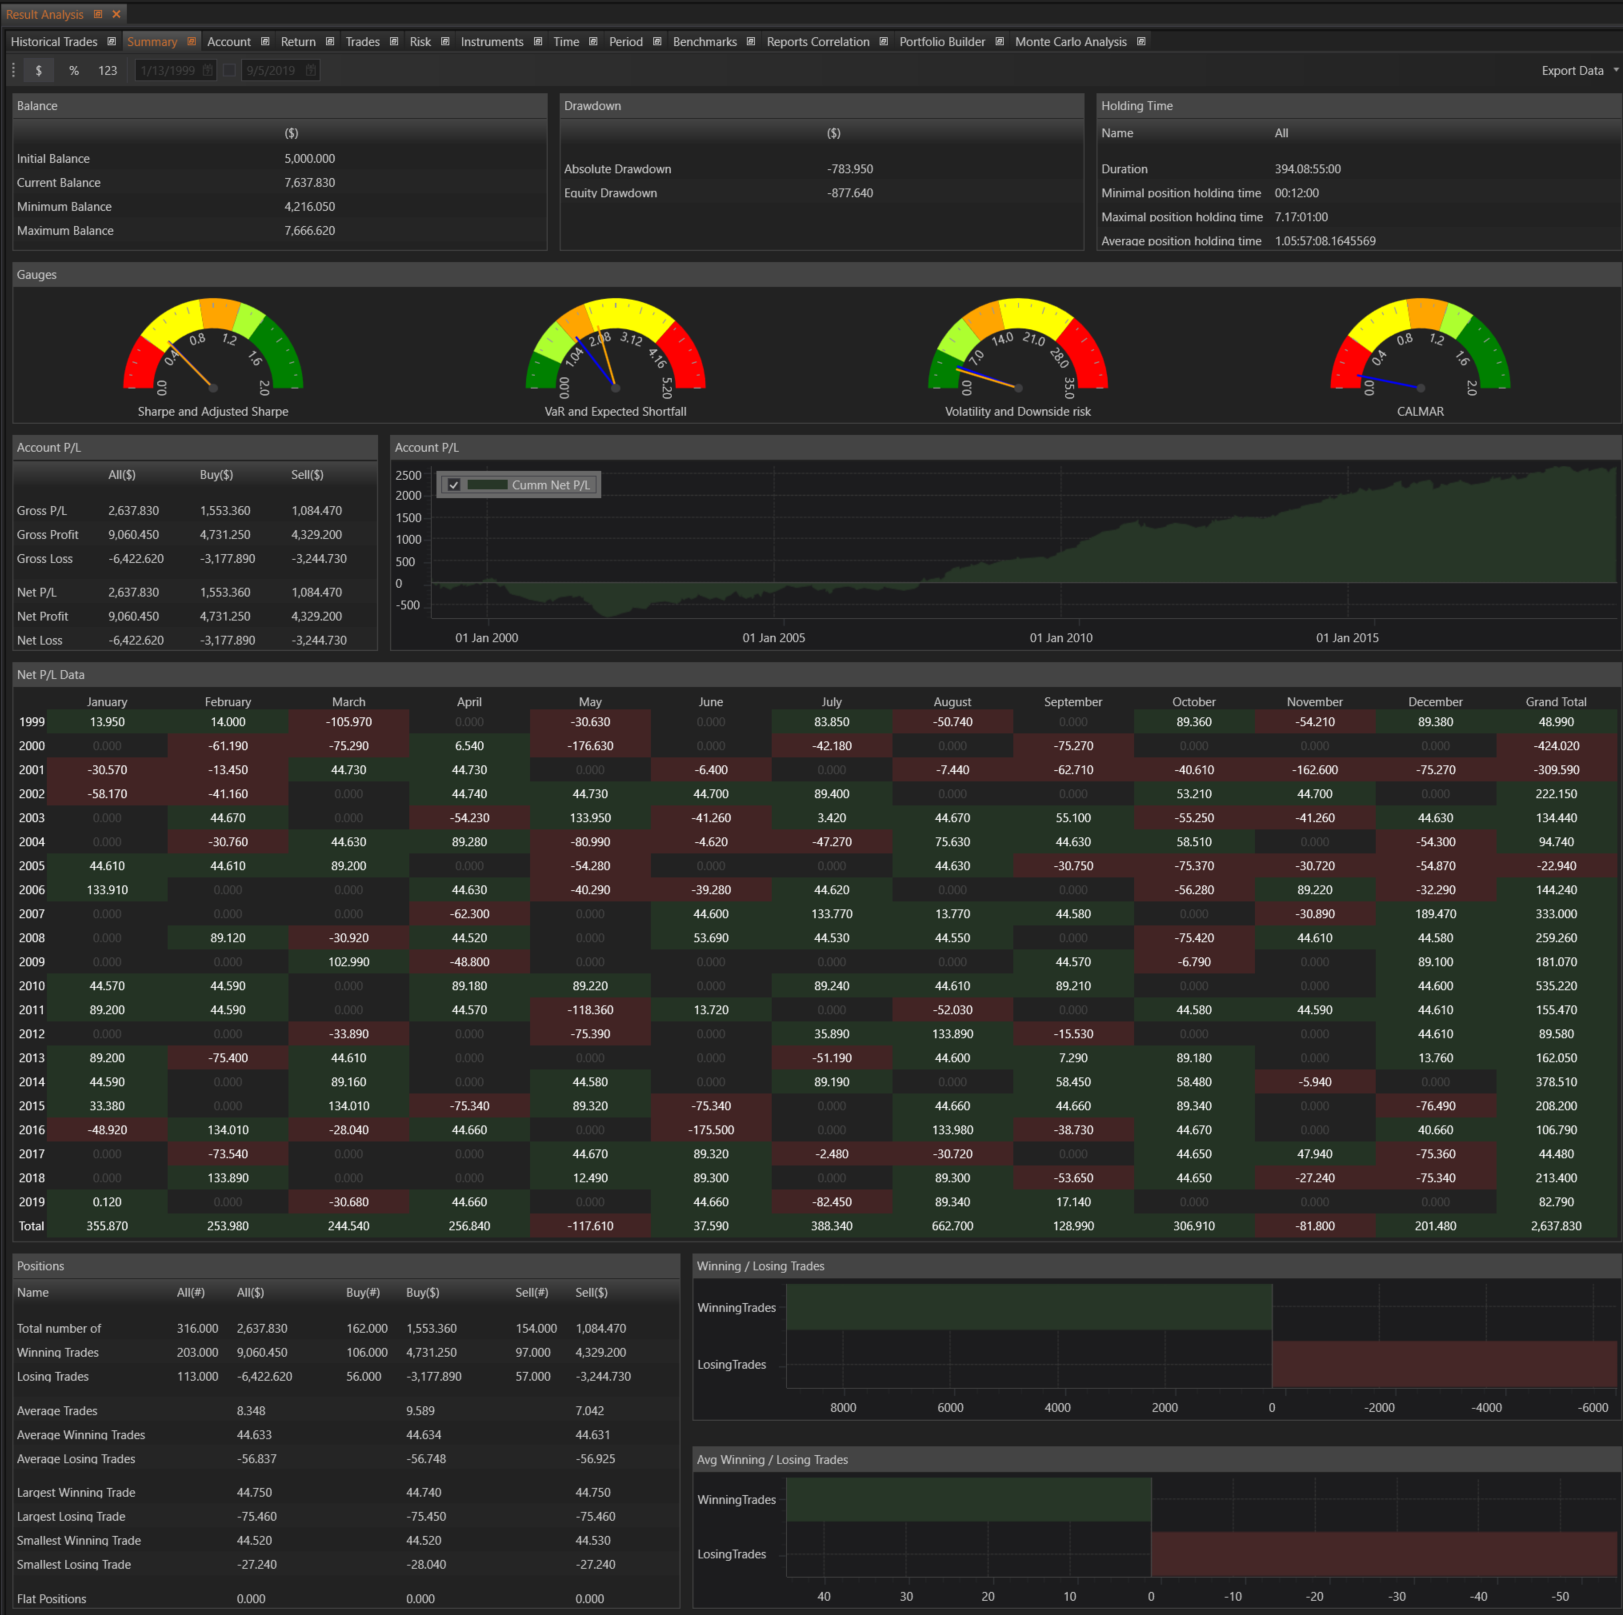
The Summary section within the Result Analysis module of FinStudio provides a comprehensive overview of a strategy's performance. It aggregates key metrics and presents them in an easily digestible format, offering traders a clear picture of their trading outcomes.
Key Features
Balance
The Balance section provides detailed information about balance changes throughout the strategy's performance.
- Initial Balance: The starting balance of the strategy.
- Current Balance: The balance amount at the end of the strategy performance.
- Minimum Balance: The lowest balance amount during the strategy performance.
- Maximum Balance: The highest balance amount during the strategy performance.
Drawdown
The Drawdown section offers insights into the strategy's drawdown metrics, crucial for understanding risk.
- Absolute Drawdown: The difference between the minimum balance and the initial balance.
- Equity Drawdown: The maximum drawdown experienced during the strategy performance.
Holding Time
This section provides information about the holding time of trades, offering insights into trade duration and efficiency.
- Duration: The total duration of all positions.
- Minimal Position Holding Time: The shortest holding time of positions.
- Maximal Position Holding Time: The longest holding time of positions.
- Average Position Holding Time: The average holding time of positions.
Gauges
The Gauges section presents graphical information about key statistical performance metrics of the strategy.
- Sharpe and Adjusted Sharpe: The Sharpe and adjusted Sharpe ratios of the strategy.
- VaR and Expected Shortfall: The Value at Risk (VaR) and expected shortfall of the strategy.
- Volatility and Downside Risk: The volatility and downside risk metrics.
- Calmar: The CALMAR ratio, indicating risk-adjusted performance.
Account P/L
This section details the account's profit and loss, providing both gross and net figures.
- Gross P/L: Calculated as Gross Profit minus Gross Loss.
- Gross Profit: The gross profit of the strategy.
- Gross Loss: The gross loss of the strategy.
- Net P/L: Calculated as Net Profit minus Net Loss.
- Net Profit: The net profit of the strategy (i.e., Gross Profit minus commissions, swaps, and fees).
- Net Loss: The net loss of the strategy.
Account P/L Graphics
This graphical representation shows the cumulative Net P/L of the strategy, helping traders visualize their performance over time.
Net P/L Data
A detailed table presents Net P/L data grouped by year and month, allowing for a time-based analysis of performance.
Positions
The Positions section offers a detailed breakdown of trades, highlighting various performance metrics.
- Total Number Of Trades: Total number of all trades, long trades, short trades, and their net P/L.
- Winning Trades: Total number of winning trades, winning long trades, winning short trades, and their net profit.
- Losing Trades: Total number of losing trades, losing long trades, losing short trades, and their net loss.
- Average Trades: Average net P/L of all trades, long trades, and short trades.
- Average Winning Trades: Average net P/L of winning trades, winning long trades, and winning short trades.
- Average Losing Trades: Average net P/L of losing trades, losing long trades, and losing short trades.
- Largest Winning Trade: The largest winning trade among all trades, long trades, and short trades.
- Largest Losing Trade: The largest losing trade among all trades, long trades, and short trades.
- Smallest Winning Trade: The smallest winning trade among all trades, long trades, and short trades.
- Smallest Losing Trade: The smallest losing trade among all trades, long trades, and short trades.
- Flat Positions: Total number of flat trades (i.e., trades with profit = 0) among all trades, long trades, and short trades.
Winning / Losing Trades Graphics
This graphic displays the profit from winning trades versus the loss from losing trades, providing a visual comparison.
Avg Winning / Losing Trades Graphics
This graphic shows the average profit from winning trades versus the average loss from losing trades, helping traders understand their trade efficiency.
Benefits
- Comprehensive Overview: Offers a complete picture of a strategy's performance through detailed metrics and graphical representations.
- Risk Management: Provides essential drawdown and volatility information, aiding in risk assessment and management.
- Performance Analysis: Detailed profit and loss breakdowns, holding times, and trade statistics help traders identify areas of strength and weakness.
- Strategic Insights: Enables traders to refine and optimize their strategies based on comprehensive performance data.
The Summary section is designed to be an indispensable tool for traders seeking to gain a deep understanding of their trading performance. By leveraging the detailed insights provided, traders can make informed decisions and improve their trading strategies for better outcomes.