The Time section within the Result Analysis module of FinStudio provides a comprehensive analysis of the duration and holding times of trades. This section helps traders understand the impact of trade duration on profitability and offers insights into holding times across different periods.
Duration
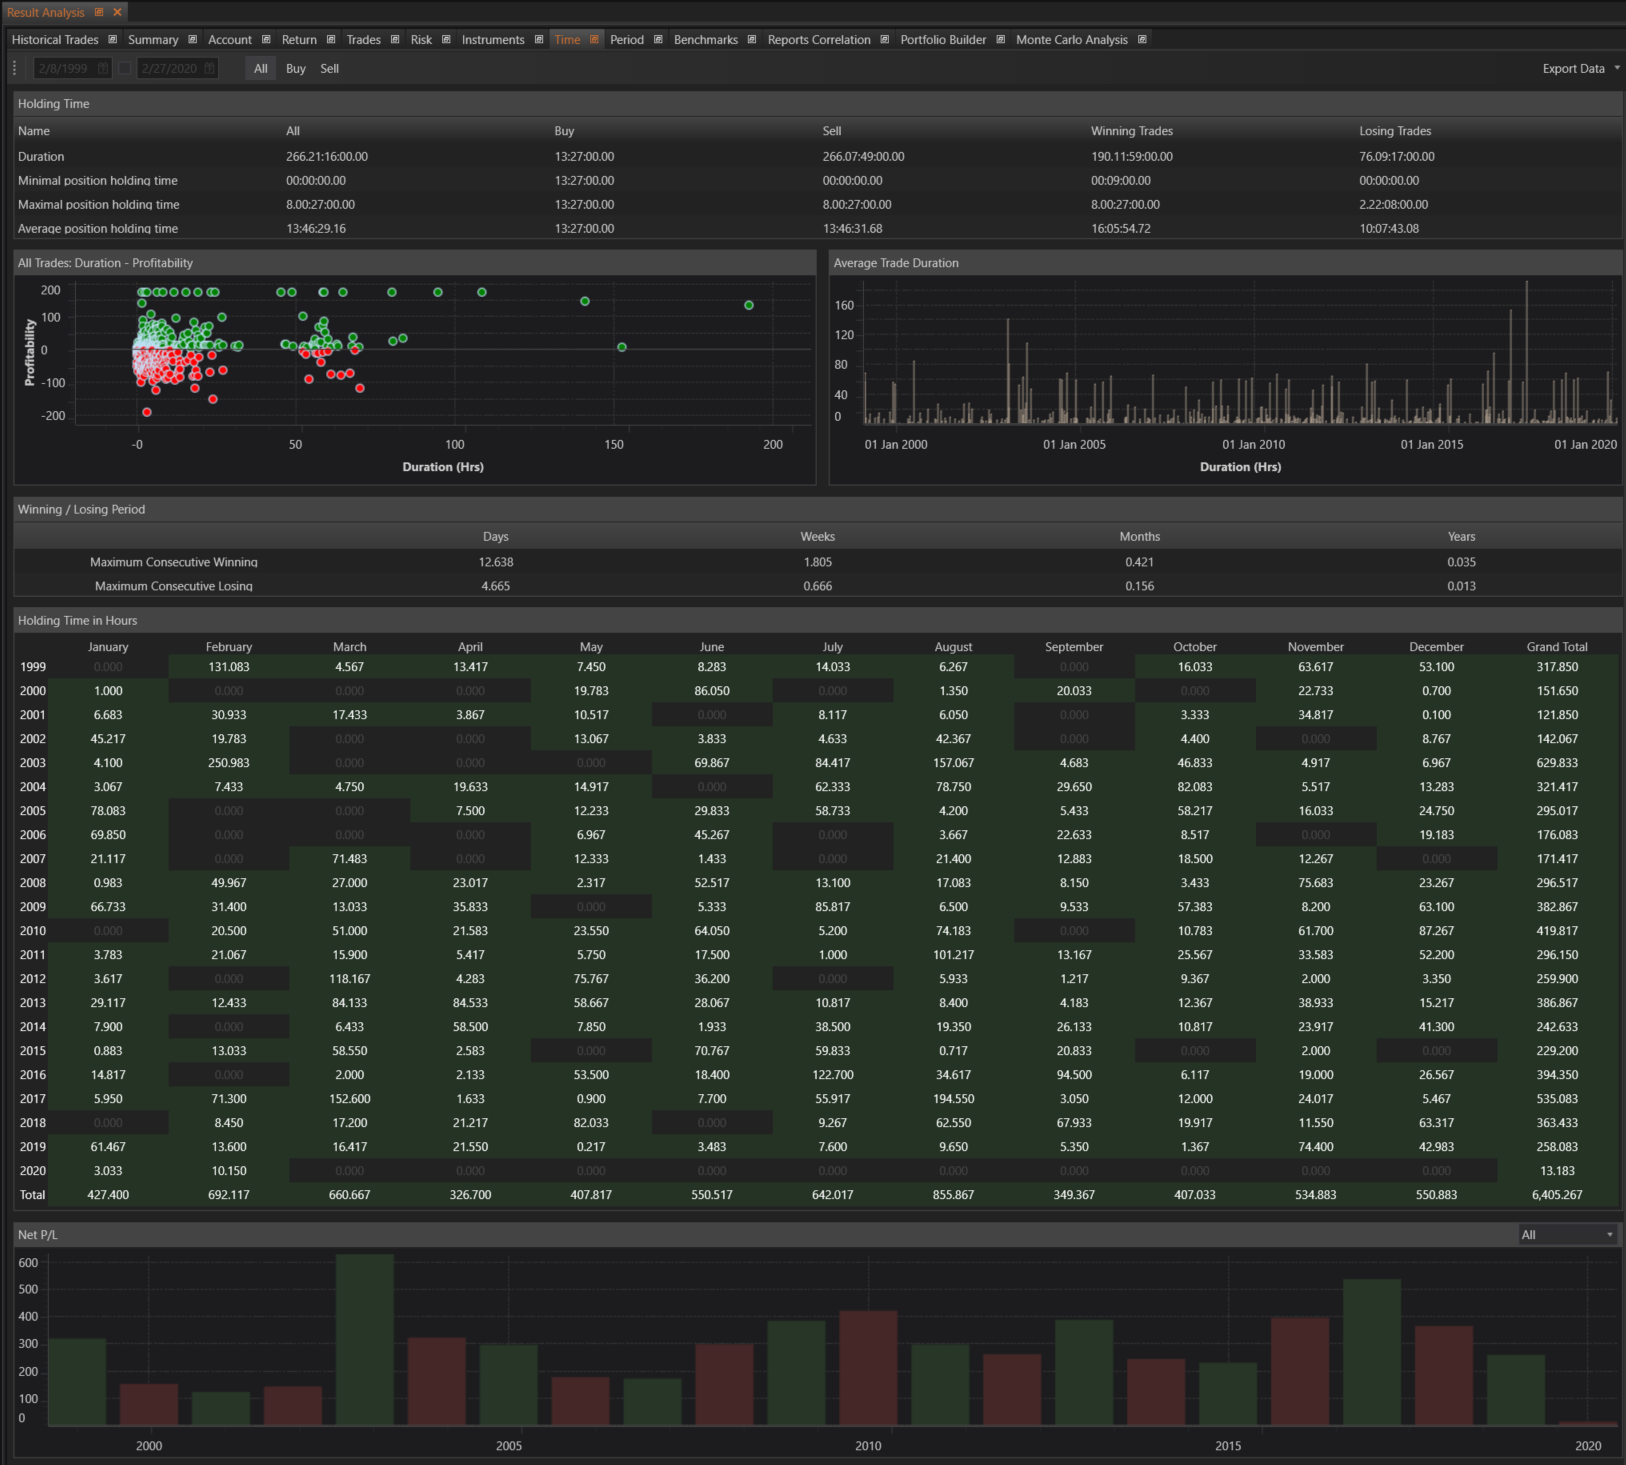
This section provides detailed metrics on the duration of all positions.
- Total Duration: The total duration of all positions.
- Minimal Position Holding Time: The minimal holding time of positions.
- Maximal Position Holding Time: The maximum holding time of positions.
- Average Position Holding Time: The average holding time of positions.
All Trades: Duration - Profitability
This feature presents a graphical representation showing the relationship between the duration of trades (in hours) and their profitability.
- Duration - Profitability: Graphics illustrating how the duration of trades in hours relates to their profitability, helping traders understand the optimal holding times for profitability.
Trade Duration
This section provides a histogram of the duration of each trade, offering a visual distribution of trade durations.
- Trade Duration: Histogram showing the duration of each trade, providing insights into the frequency of different trade durations.
Winning / Losing Period
This feature provides tables with information about the duration of maximum consecutive winning and losing series.
- Maximum Consecutive Winning: Table detailing the duration of maximum consecutive winning series in days, weeks, months, and years.
- Maximum Consecutive Losing: Table detailing the duration of maximum consecutive losing series in days, weeks, months, and years.
Holding Time in Hours
This section offers a detailed table of the holding time of trades in hours, grouped by year and month.
- Holding Time in Hours: Table showing the holding time of trades in hours, grouped by year and month, allowing for a time-based analysis of trade durations.
Holding Time in Hours Chart
This graphical representation shows the holding time of trades in hours, grouped by year, providing a long-term view of holding time trends.
- Holding Time in Hours Chart: Graphics illustrating the holding time of trades in hours, grouped by year, offering insights into how holding times have evolved over time.
Benefits
- Comprehensive Duration Analysis: Provides detailed insights into the duration and holding times of trades, helping traders optimize their strategies.
- Profitability Insights: Helps traders understand the relationship between trade duration and profitability, aiding in decision-making for trade management.
- Trend Analysis: Offers graphical representations and tables to analyze holding times and duration trends over different periods.
- Performance Evaluation: Assists traders in evaluating their performance based on trade duration, helping to refine trading strategies for better outcomes.
The Time section is designed to give traders a thorough understanding of the impact of trade duration and holding times on their trading performance. By leveraging the detailed insights provided, traders can optimize their trade management strategies, improve profitability, and achieve more consistent trading results.