Overview
The Graphs properties section within FinStudio's Application Themes module provides extensive customization options for graphs used in various analytical modules like Result Analysis and Backtester. Properly configured graph properties enhance visual clarity, facilitate data interpretation, and ensure graphs are both functional and aesthetically pleasing.
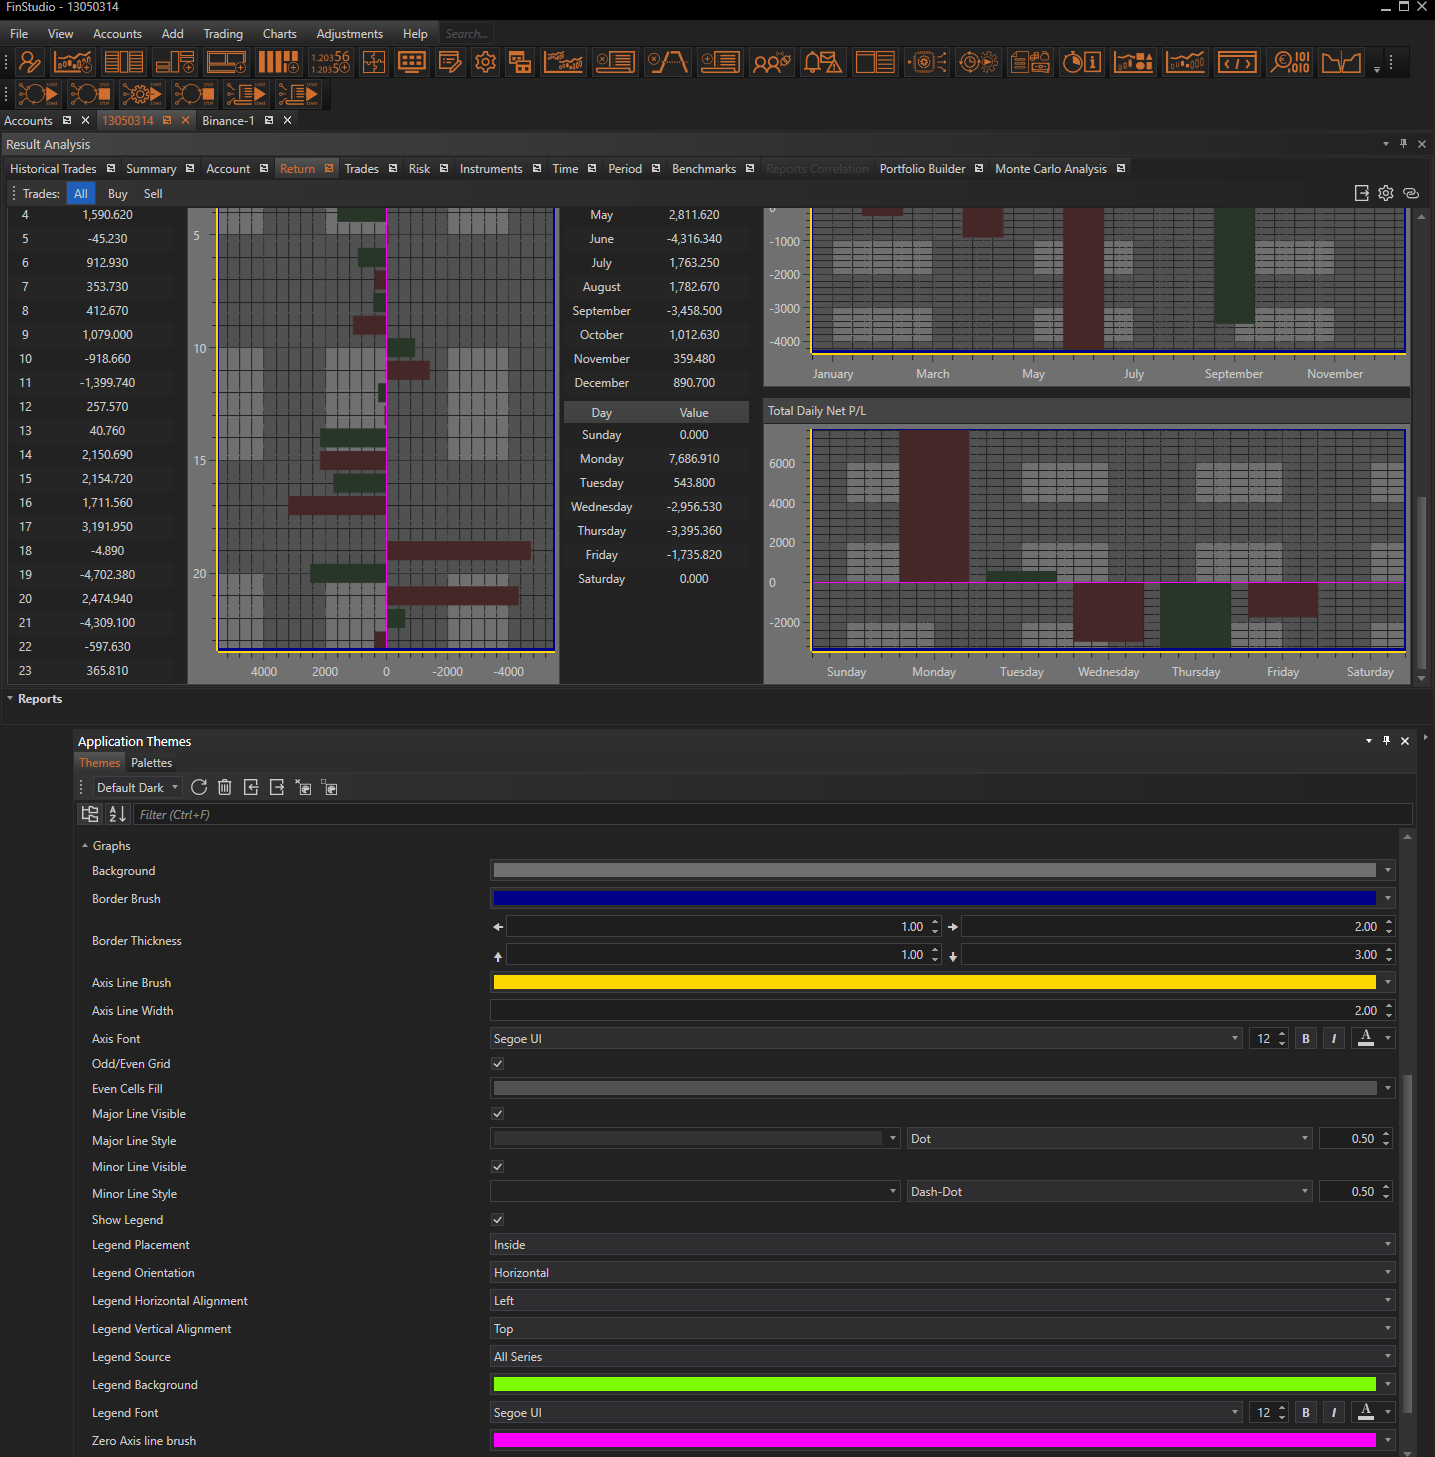
Customizing Graphs Properties
Background:
- Functionality: Sets the background color of the graph area.
- Impact: A suitable background color enhances the readability of graph data and reduces visual strain, especially during extended analysis sessions.
Border Brush and Thickness:
- Functionality: Allows customization of the border color and thickness around the graph.
- Impact: Borders define the graph's limits and can help focus the viewer's attention on the data. Adjustable thickness provides flexibility in how pronounced these borders appear.
Axis Line Brush and Width:
- Functionality: Determines the color and width of the axis lines in the graph.
- Impact: Clear and distinct axis lines aid in the readability of data scales and values, which is crucial for accurate data interpretation.
Axis Font:
- Functionality: Customizes the font used for axis labels, including size and color.
- Impact: Legible and well-styled axis fonts are essential for easily reading the values and understanding the scale of the graph.
Odd/Even Grid:
- Functionality: Enables different coloring for odd and even chart levels or grid cells.
- Impact: This feature helps in distinguishing different sections of the graph, improving the ability to track data points across a complex dataset.
Line Visibility and Style (Major and Minor Lines):
- Functionality: Configures the visibility, color, width, and style (solid, dash, etc.) of major and minor grid lines.
- Impact: Major lines highlight significant data intervals, while minor lines provide detailed granularity. Customizing these lines enhances data tracking and aesthetic appeal.
Legend Settings:
- Show Legend: Toggles the visibility of the graph legend.
- Legend Placement: Selects the position of the legend (e.g., Bottom Left, Top Right, etc.).
- Legend Orientation: Chooses between horizontal or vertical orientation for the legend.
- Legend Alignment: Adjusts the horizontal and vertical alignment of the legend.
- Legend Source: Determines the data source for the legend (e.g., All Series, Selected Series).
- Legend Background and Font: Sets the background color and customizes the font of the legend.
- Impact: The legend is crucial for identifying what each graphical element represents, especially in complex graphs with multiple data series. Properly configured legends enhance the graph's usability and readability.
Zero Axis Line Brush:
- Functionality: Sets the color of the zero axis line, often used to denote a baseline or starting point in graphs.
- Impact: A visible zero axis line is essential for graphs depicting growth or decline relative to a baseline, providing a clear reference point for analysis.
Implementing Changes: Steps for Customization
-
Access Graph Properties:
- Navigate to the 'Graphs' category within the Theme Tab of the Application Themes module to start adjusting the visual settings specific to graphs.
- Navigate to the 'Graphs' category within the Theme Tab of the Application Themes module to start adjusting the visual settings specific to graphs.
-
Modify Visual Elements:
- Adjust the background, borders, axes, grid lines, and legend settings using the provided tools. Preview the changes in real-time to assess their impact on the graph's clarity and presentation.
- Adjust the background, borders, axes, grid lines, and legend settings using the provided tools. Preview the changes in real-time to assess their impact on the graph's clarity and presentation.
-
Apply and Evaluate:
- After configuring the desired settings, apply the changes to update the appearance of graphs throughout the application. It’s crucial to evaluate these changes in the context of actual data presentation to ensure that the adjustments aid in better visualization and understanding.
Best Practices
-
Consistency Across Graphs:
- Ensure that graph settings are consistent across different modules to maintain a cohesive look and user experience.
-
Contrast for Readability:
- Choose colors that offer good contrast between the graph background, data lines, and text to ensure that all elements are easily distinguishable.
-
Functionality Over Style:
- While aesthetic customization is important, prioritize the functional aspects of graph settings to enhance data interpretation and decision-making accuracy.
Conclusion
Customizing the Graphs properties in FinStudio's Application Themes module is key to creating an intuitive and visually appealing analytical environment. By carefully selecting colors, styles, and settings for various graphical elements, users can ensure that the graphs not only fit well with the application's overall design but also significantly improve data analysis efficiency.