Overview
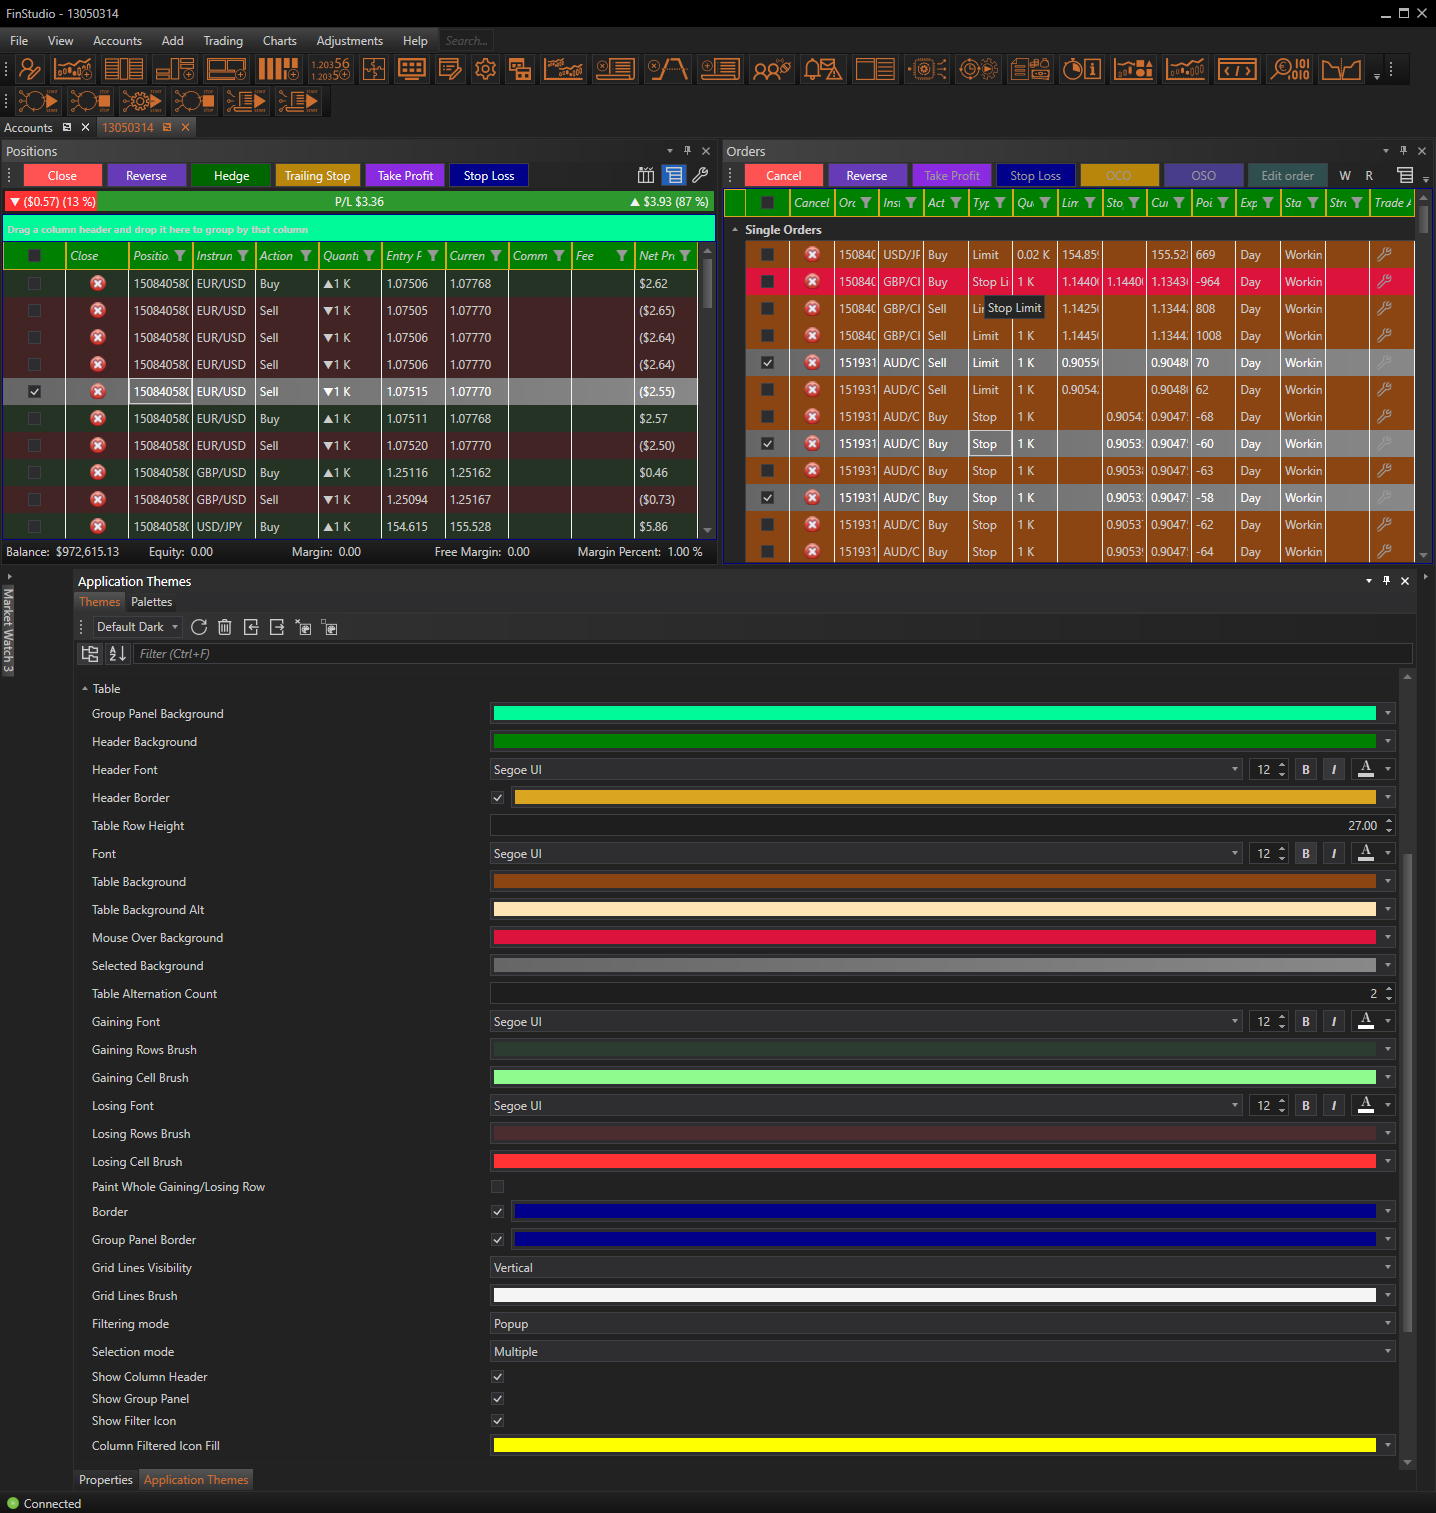
The Table properties section in FinStudio's Application Themes module offers extensive customization options for table displays within the trading platform. Tables are crucial for displaying financial data, orders, transactions, and other critical information in a structured manner. Properly configured table properties enhance readability, user interaction, and visual coherence.
Customizing Table Properties
Group Panel Background:
- Functionality: Sets the background color of the grouping panel toolbar.
- Impact: This color setting helps distinguish the grouping panel from other parts of the table, enhancing the visual organization of data.
Header Background:
- Functionality: Determines the background color of the table header.
- Impact: A clear and distinct header background is crucial for users to easily identify the different data columns and navigate through the table efficiently.
Header Font:
- Functionality: Customizes the font, size, and color of the table header text.
- Impact: The header font settings are important for readability and can be adjusted to ensure visibility and aesthetic alignment with the application’s theme.
Header Border Visible & Brush:
- Functionality: Allows toggling the visibility of the header border and setting its color.
- Impact: A visible border can define the header more clearly against the rows, aiding in the visual separation of table sections.
Table Row Height:
- Functionality: Adjusts the height of table rows.
- Impact: Proper row height enhances the readability and accessibility of table data, providing enough space for text without wasting screen area.
Table Background and Table Background Alt:
- Functionality: Sets the primary and alternate background colors for table rows.
- Impact: Alternate row coloring (zebra striping) improves the differentiation between rows, reducing visual fatigue and making it easier to follow data across a line.
Mouse Over Background:
- Functionality: Defines the row color when hovered over with the mouse.
- Impact: This visual cue highlights the row under the cursor, improving user interaction with table data.
Selected Background:
- Functionality: Sets the background color of selected rows.
- Impact: Helps clearly indicate which rows are actively selected, crucial for operations involving multiple data manipulations.
Table Alternation Count:
- Functionality: Determines how many rows before the alternate color is applied.
- Impact: Configuring this setting allows users to customize how striping is applied, based on their visual preference and the density of the table data.
Gaining and Losing Rows/Cells:
- Functionality: Sets fonts and colors for rows and cells that are gaining or losing.
- Impact: These settings provide immediate visual feedback on data trends, highlighting positive or negative changes dynamically.
Paint Whole Gaining/Losing Row:
- Functionality: Chooses whether to apply color to the entire row or just the cell for gaining/losing data.
- Impact: This can enhance the visibility of trends or anomalies in data, aiding quicker decision-making.
Border Visible & Brush, Group Panel Border Visible & Brush:
- Functionality: Configures the visibility and color of borders around the table and group panel.
- Impact: Borders can help frame the table and group panels distinctively, enhancing the structure and clarity of the interface.
Additional Functionalities:
- Grid Lines Visibility, Filtering Mode, Selection Mode: These settings provide further control over how data is displayed and interacted with, from how grid lines are shown, to how filters are displayed and applied, to how rows can be selected.
- Show Column Header, Show Group Panel, Show Filter Icon: Toggle these elements for a cleaner look or enhanced functionality, depending on user needs.
Conclusion
Customizing the Table properties in FinStudio's Application Themes module allows for a highly tailored and functional display of tabular data. By adjusting these settings, users can ensure that tables not only fit well with the application's overall design but also meet specific usability and interaction requirements. This level of customization is key in environments where data presentation and quick interpretation are critical to effective trading.