Overview
The Charts settings within the Settings module provide comprehensive options for configuring how charts are displayed and function within the trading platform. This page is divided into two main subsections: Quick Chart Settings and Performance, each addressing specific aspects of chart setup and rendering performance.
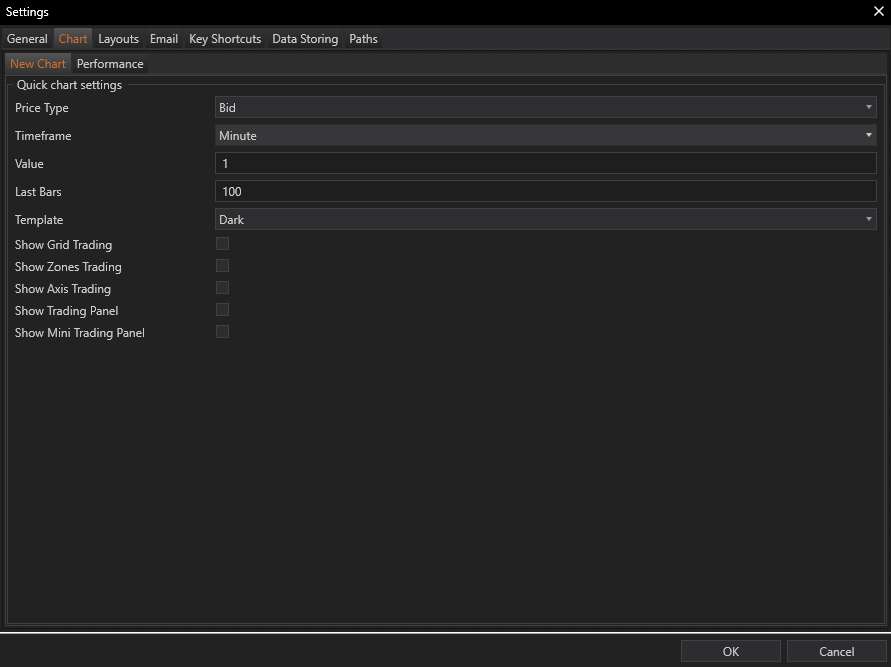
Quick Chart Settings
Functionality: This section allows traders to pre-configure settings for quick charts, which can be launched directly from the Market Watch instrument via the right-click menu. These settings ensure that each quick chart opens with predefined parameters, streamlining the analysis process.
Configurable Options:
-
Price Type:
- Description: Selects the price data type on which the chart will be based—Bid, Ask, or Last.
- Application: Tailors the chart to reflect the most relevant pricing information, depending on the trader’s focus, such as bid prices for sellers or ask prices for buyers.
- Description: Selects the price data type on which the chart will be based—Bid, Ask, or Last.
-
Timeframe:
- Description: Sets the period interval for the chart, ranging from Tick, Second, Minute, Hour, Day, Week, Month, to Year.
- Application: Enables traders to view historical price action over their preferred time scale, crucial for different trading strategies from scalping to long-term investments.
- Description: Sets the period interval for the chart, ranging from Tick, Second, Minute, Hour, Day, Week, Month, to Year.
-
Last Bars:
- Description: Determines the number of bars that should be initially loaded into the chart.
- Application: Controls the depth of historical data displayed, affecting loading times and data relevance.
- Description: Determines the number of bars that should be initially loaded into the chart.
-
Template:
- Description: Specifies a chart template that should be applied automatically to the chart.
- Application: Allows traders to apply custom visual styles and pre-configured analysis tools to new charts quickly.
- Description: Specifies a chart template that should be applied automatically to the chart.
-
Trading Panels:
- Description: Options to toggle various trading panels such as Grid Trading, Zones Trading, Axis Trading, the main Trading Panel, and the Mini Trading Panel on the chart.
- Application: These tools add layers of interactive elements to the chart, enhancing analysis with visual aids and quick trading functionalities.
- Description: Options to toggle various trading panels such as Grid Trading, Zones Trading, Axis Trading, the main Trading Panel, and the Mini Trading Panel on the chart.
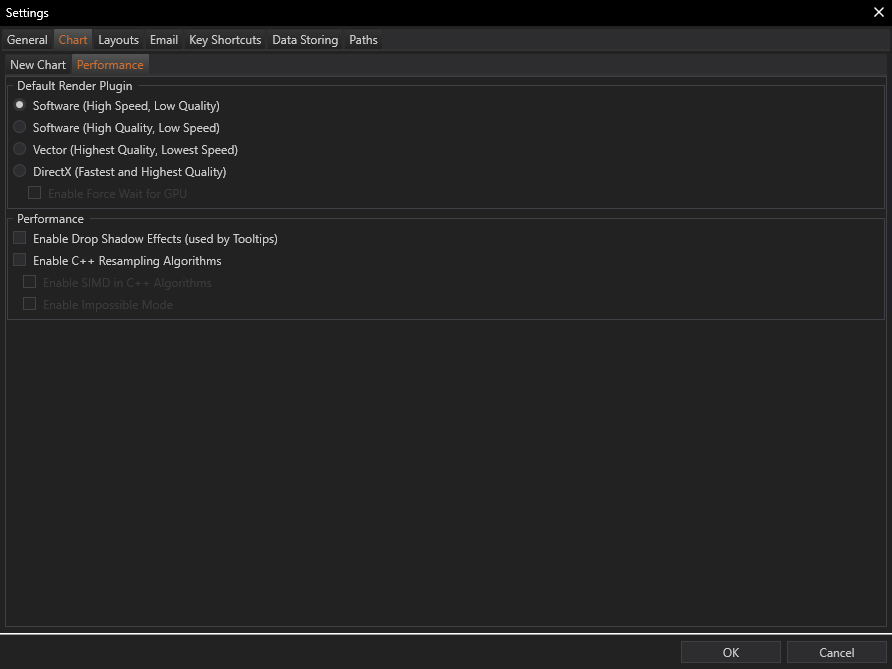
Performance
Functionality: This subsection focuses on optimizing the rendering and operational performance of charts within the platform, addressing the balance between visual quality and processing speed.
Configurable Options:
-
Default Render Plugin:
- Choices:
- Software (High Speed, Low Quality): Optimizes charts for speed, sacrificing visual fidelity.
- Software (High Quality, Low Speed): Prioritizes detail and visual quality, suitable for in-depth analysis.
- Vector (Highest Quality, Lowest Speed): Offers the best visual quality for detailed graphical analysis.
- DirectX (Fastest and Highest Quality): Provides an optimal balance between speed and quality, recommended for most users.
- Software (High Speed, Low Quality): Optimizes charts for speed, sacrificing visual fidelity.
- Application: Allows traders to select a rendering method that best matches their hardware capabilities and trading needs.
- Choices:
-
Enable Force Wait for GPU:
- Description: Forces the chart rendering to synchronize with the GPU’s processing cycles, potentially smoothing out visuals at the cost of slight input lag.
- Application: Useful for setups where maintaining visual consistency across multiple monitors is necessary.
- Description: Forces the chart rendering to synchronize with the GPU’s processing cycles, potentially smoothing out visuals at the cost of slight input lag.
-
Performance Enhancements:
- Enable Drop Shadow Effects (used by Tooltips): Adds visual effects to tooltips for better visibility.
- Enable C++ Resampling Algorithm: Utilizes a more advanced resampling method for rendering chart data, enhancing the clarity and accuracy of visual elements.
- Enable Drop Shadow Effects (used by Tooltips): Adds visual effects to tooltips for better visibility.
Conclusion
The Charts tab in Settings module is designed to provide traders with extensive control over how charts are configured and displayed, catering to a wide range of preferences and requirements. From basic setup options in the Quick Chart Settings to advanced graphical performance adjustments, these settings allow traders to tailor their charting environment to optimize both functionality and aesthetics, ensuring that the charts not only look good but also perform well under various trading conditions.